Day 4 - PostHog Toolbar – Visual Event Tracking
The Easy Part: Setting Up the Toolbar
Hey_Techys!! Day 4 of the PostHog series!
Today, I launched the toolbar to see how it works and the setup was quite easy. If I'm being fair, so far, this has been my easiest exploration in the PostHog features.
All I did was:
Open the Toolbar route in the PostHog app
Enter an authorized URL (where my TaskFlow app was running)
Click the launch button

My app opened with a toolbar sitting at the bottom of the page.
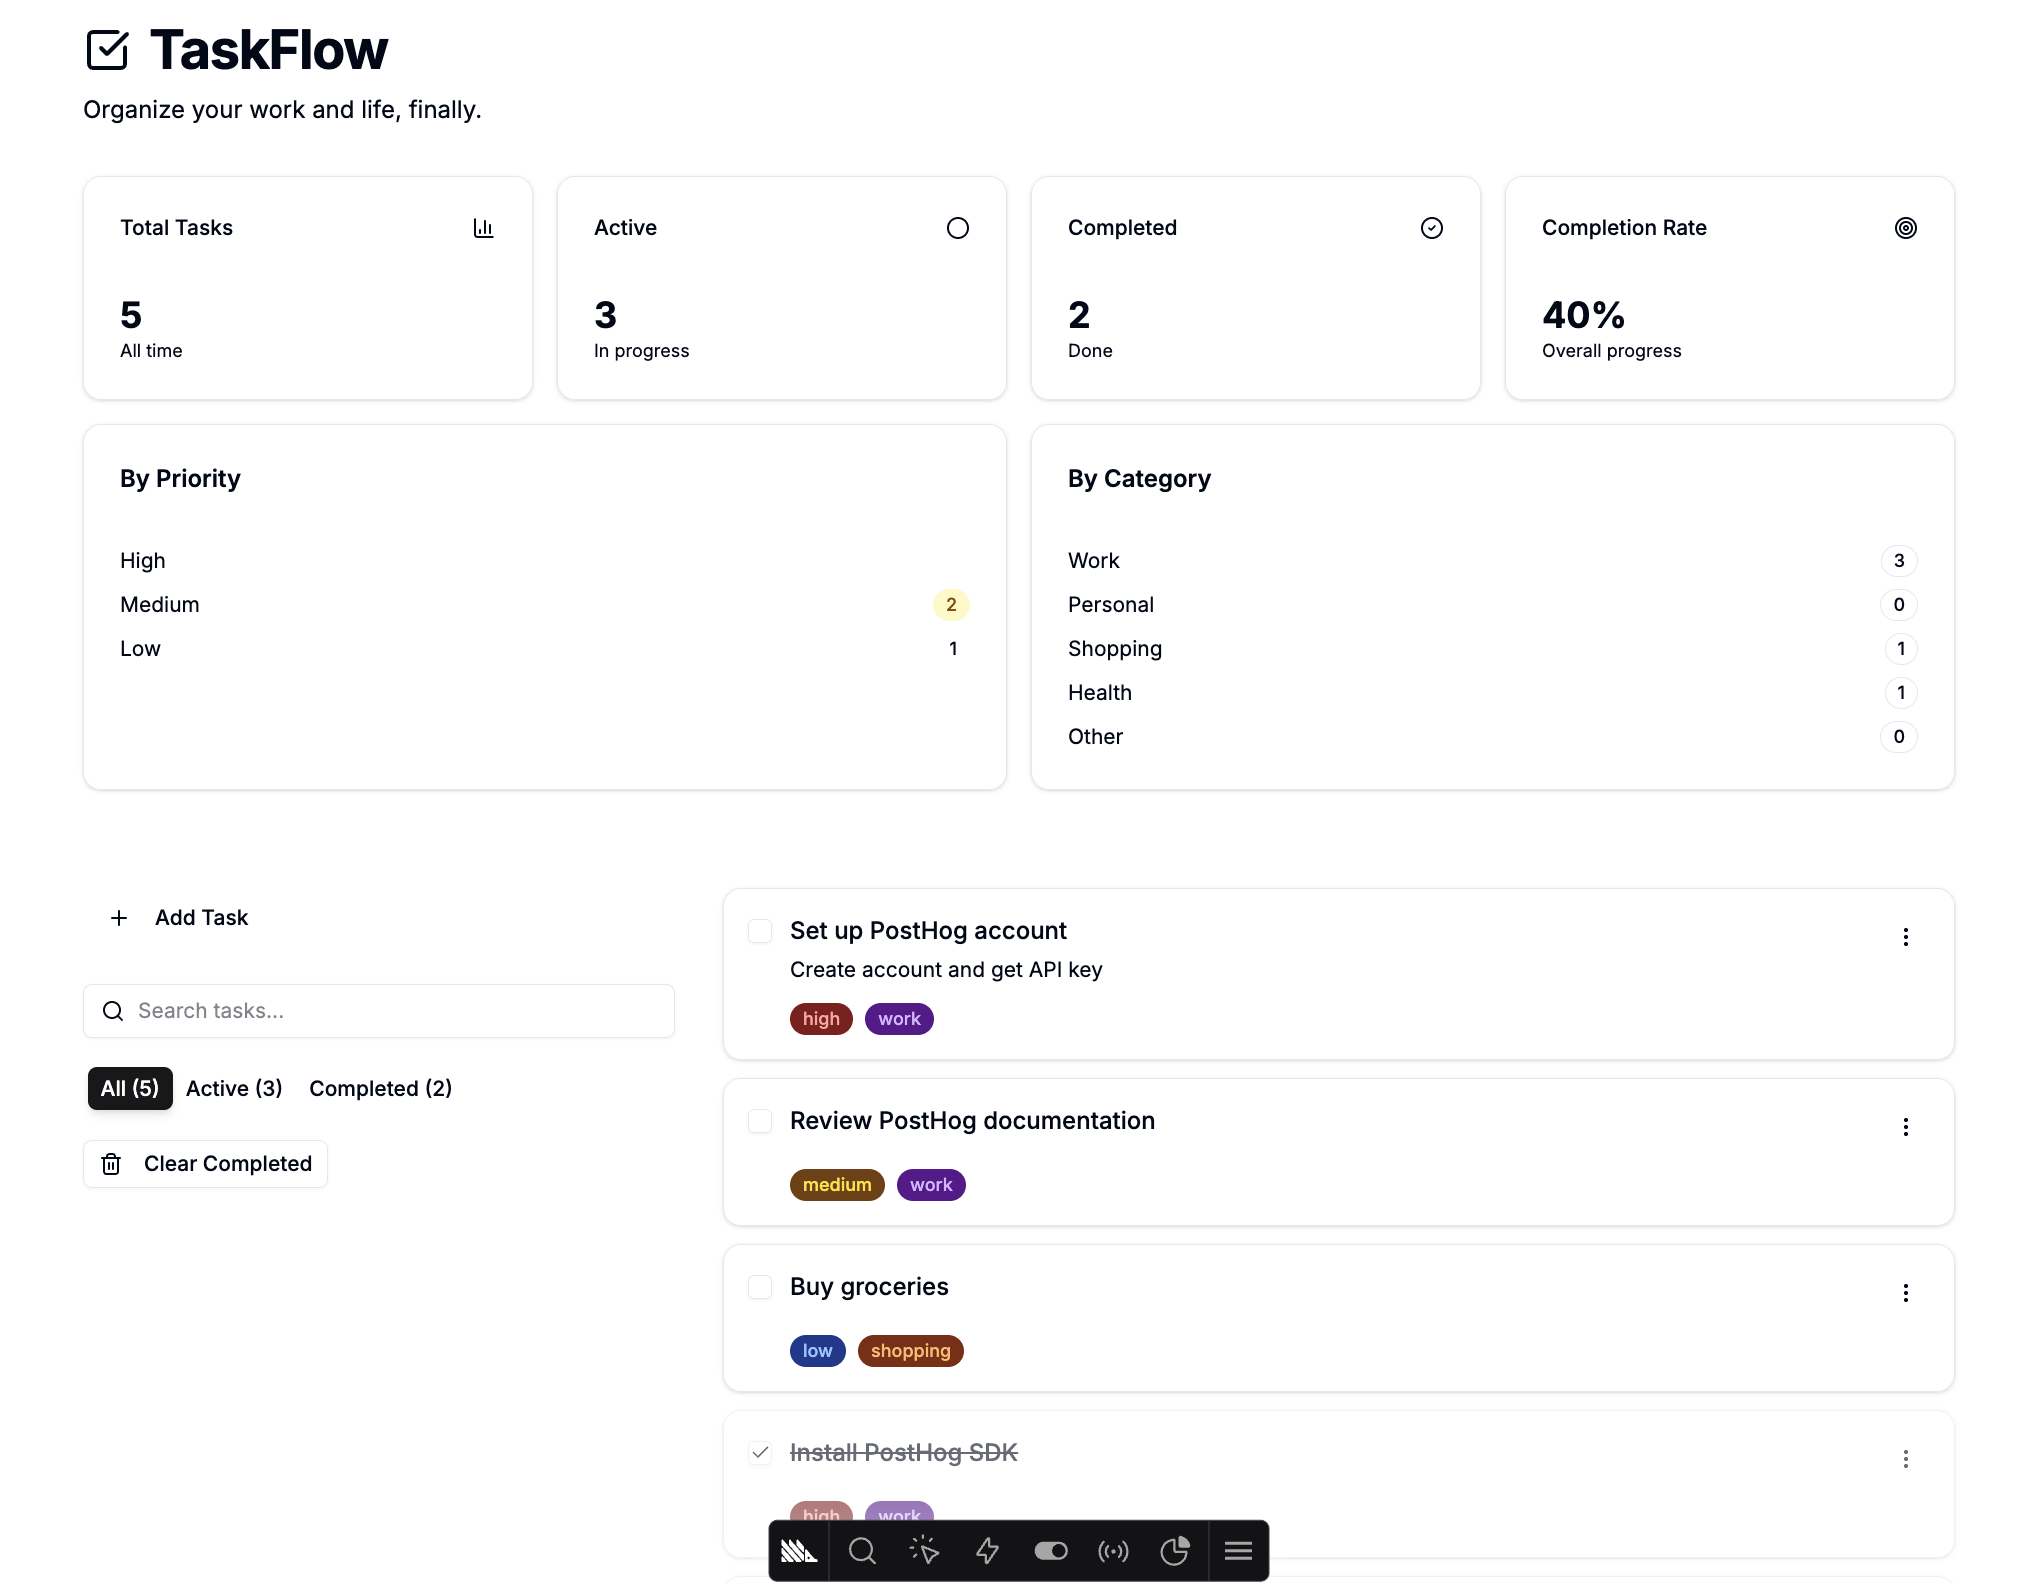
I have to give a shoutout to the team who created this toolbar because I was deeply impressed and I really had fun exploring this.
Exploring the Toolbar Features
So this is how my exploration went. I played around with each button starting with the PostHog icon that allowed me to close and open the toolbar whenever I wanted to.
The Inspect Mode (Purple Highlights)
Then I clicked on the search icon, which allowed me to inspect highlighted elements I could create an action from.
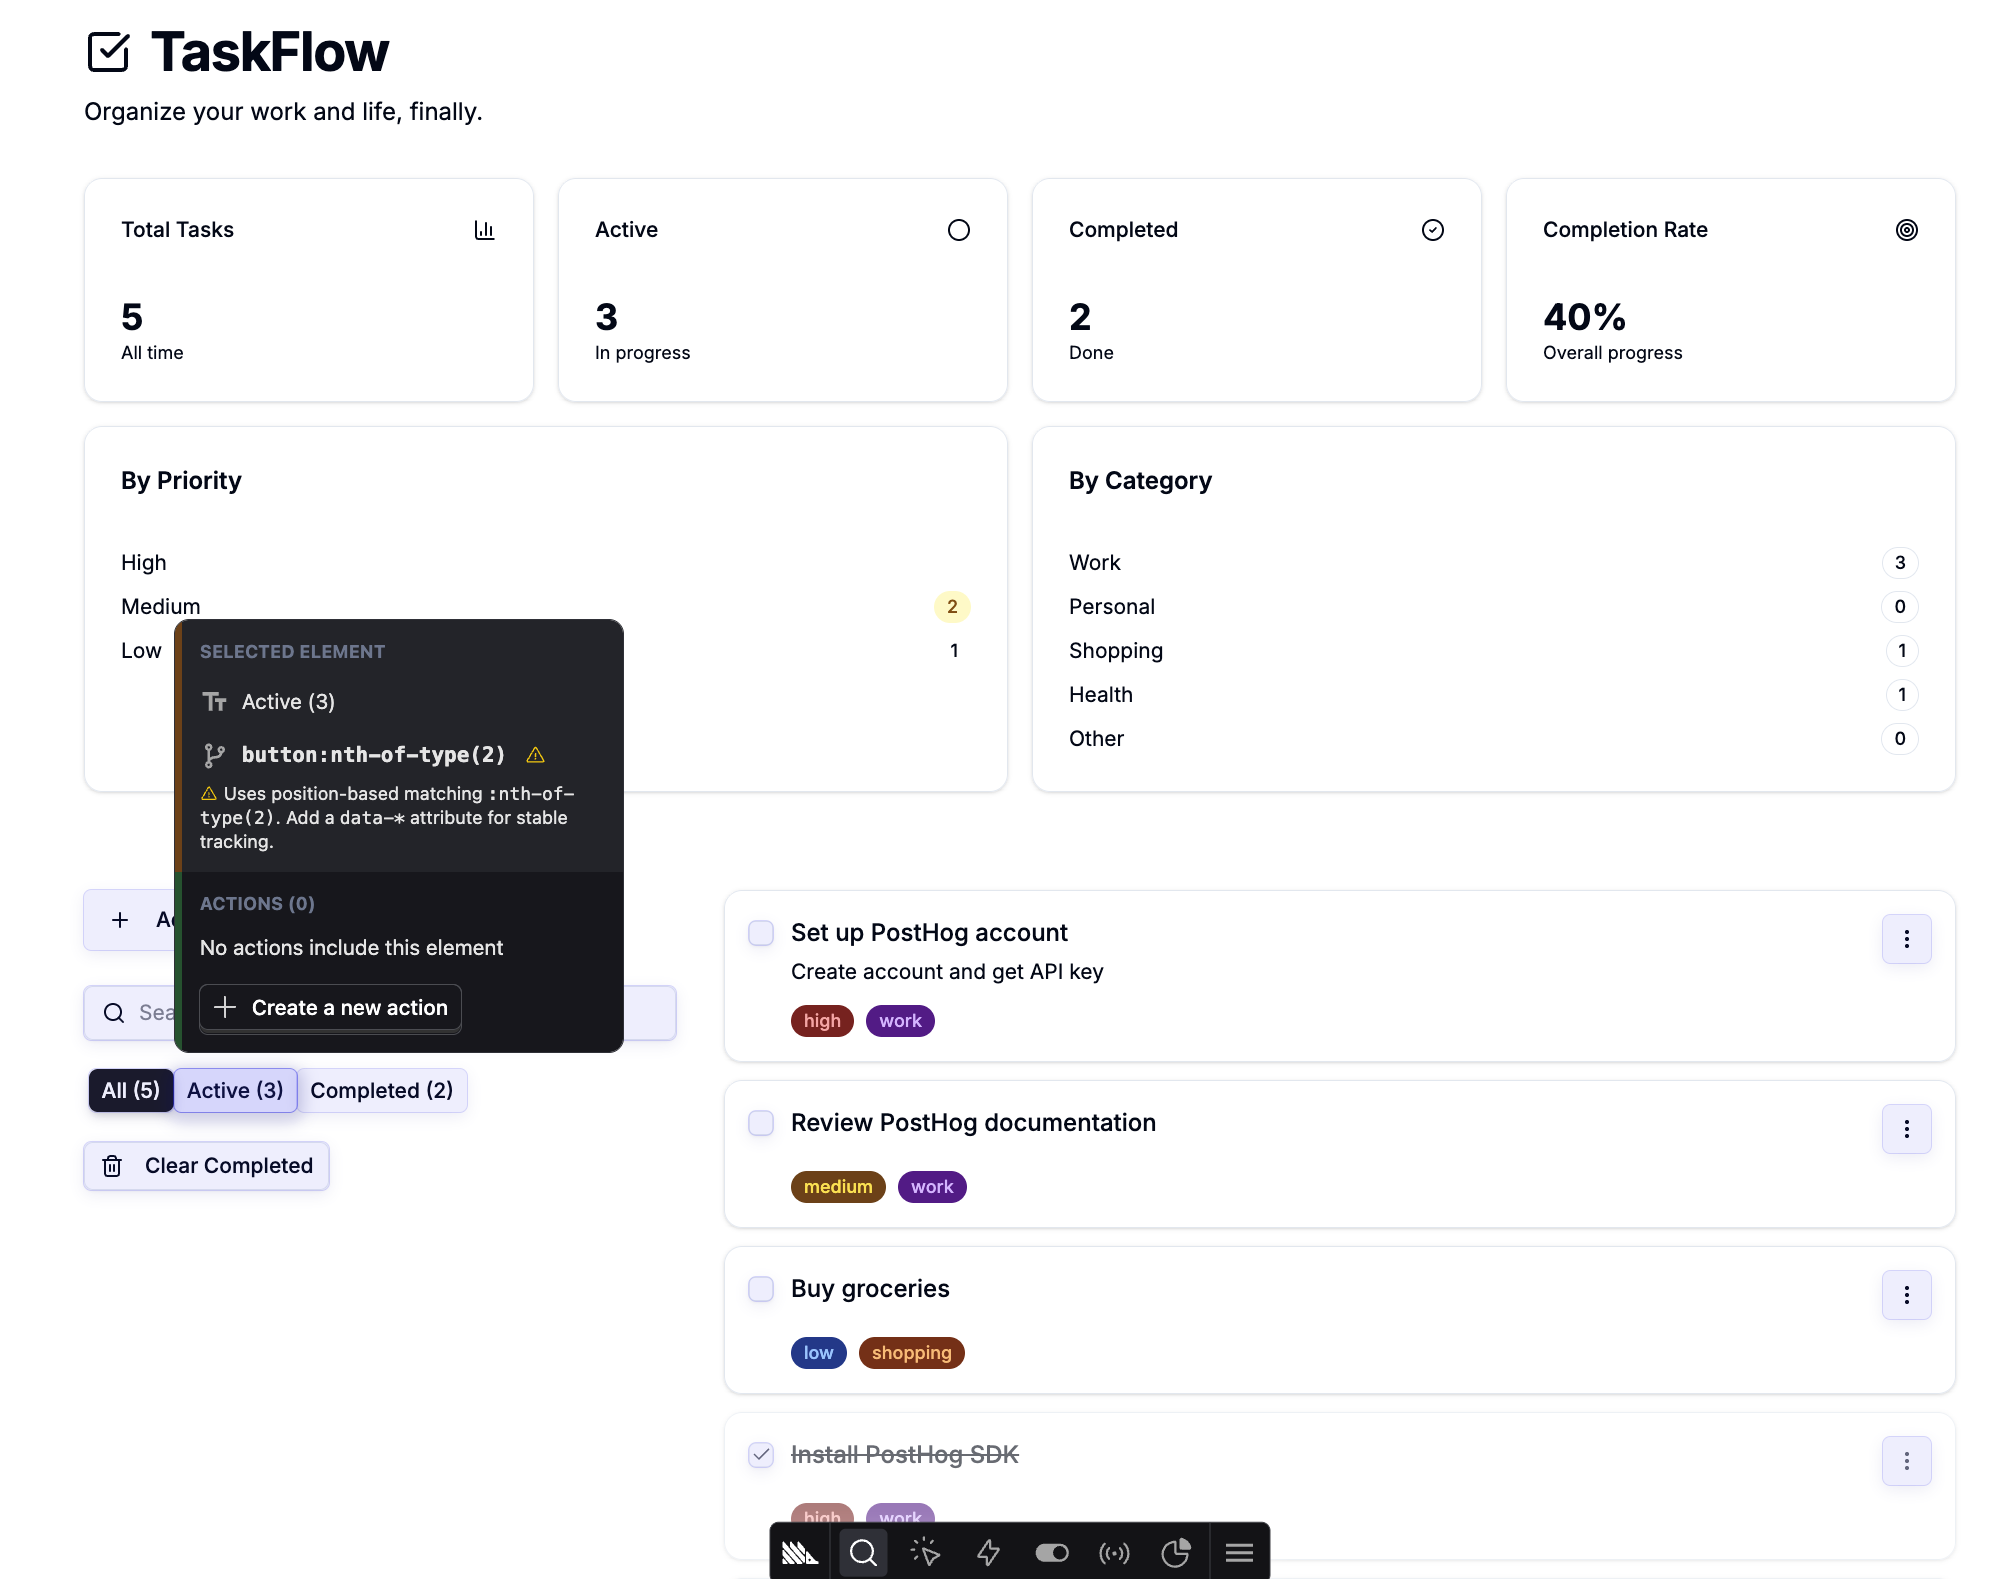
I have zero idea why PostHog selected certain elements themselves. Is it because those elements are able to perform an action and the others are just presentational UI components? I don't know, but it felt like partia (Nigerian slang for cheating).
All the elements covered in purple are the ones selected by PostHog to inspect. When you hover over any element, you see extra information regarding that element.
Once again, kudos to the PostHog team.
Heatmaps: Seeing Where Users Click
After that, I clicked on the Heatmap icon that showed me how users interacted with my page.
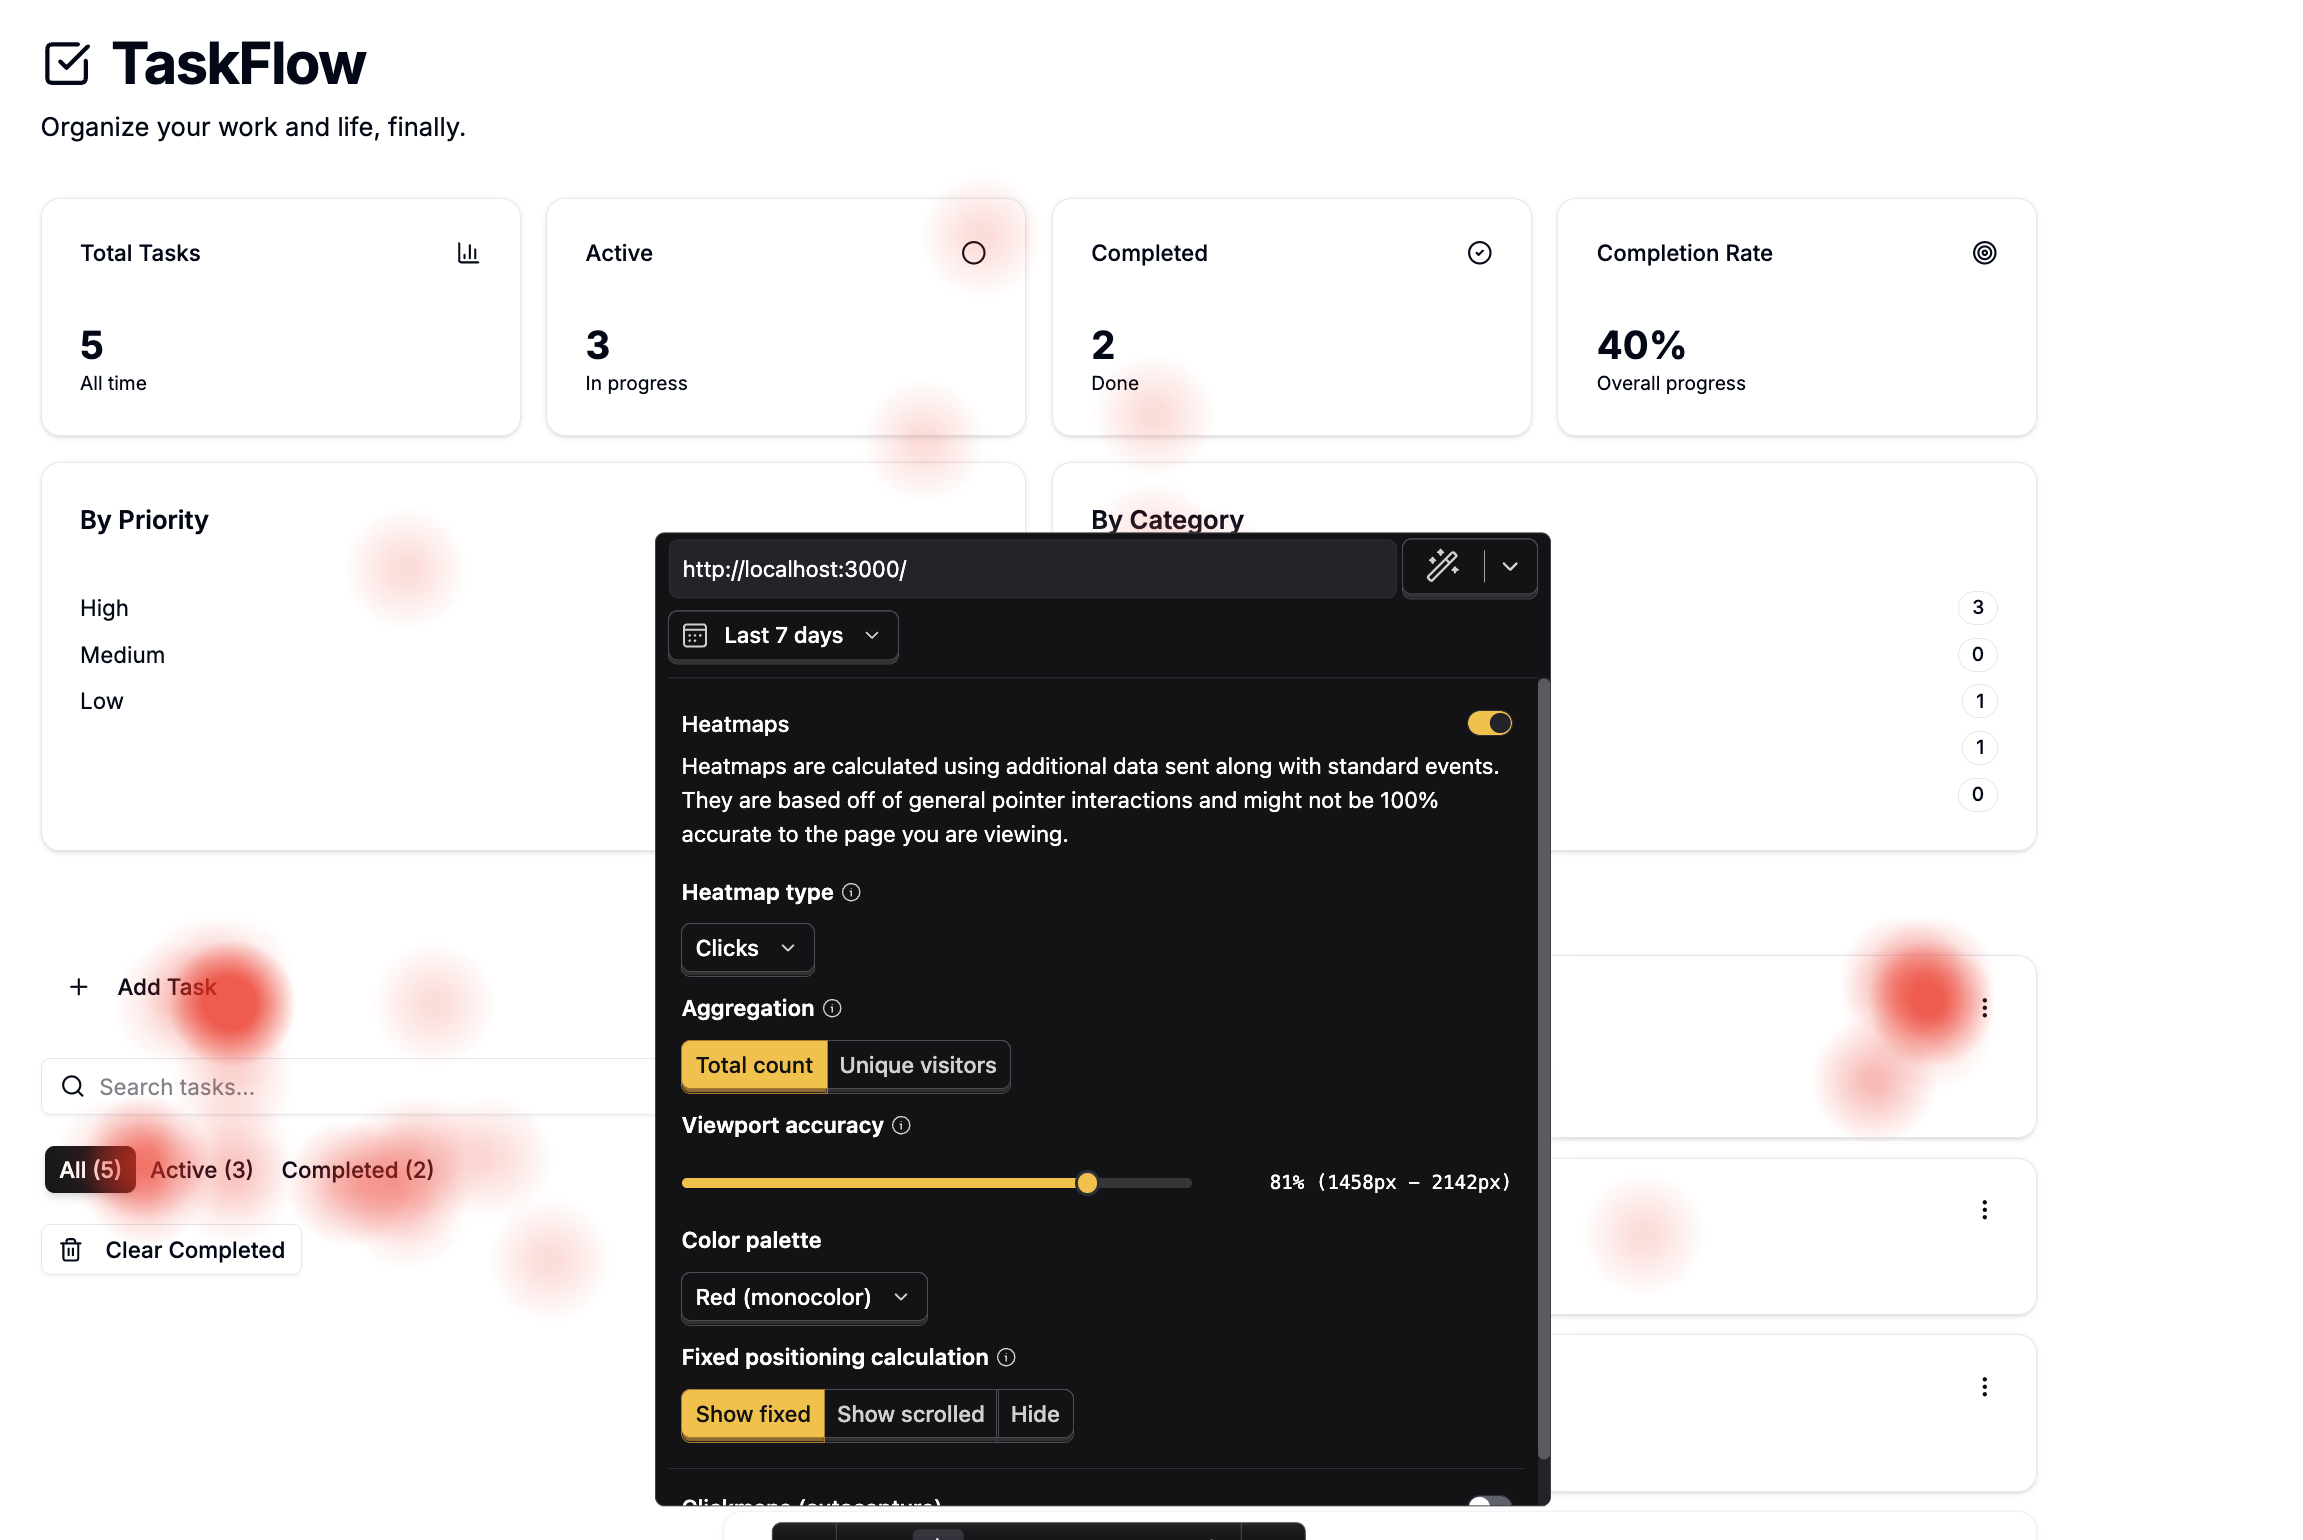
What you can do with heatmaps:
You can select the number of days for user interaction from the filter at the top. When you open heatmaps, you see areas clicked by users colored, and the intensity of the color is dependent on how much the user clicked that particular section. When you hover on the color, you'll see how many times users clicked.
Heatmap types available:
Clicks: See where your users clicked the most
Rageclick: See how many times your user had to click something before they got their result
Deadclicks: See where users clicked that led nowhere
Mousemove: See areas your users moved to
Scrolldepth: See how far your users scrolled
Aggregation options:
Total count: See how random users and unique users clicked the app
Unique visitors: See areas your unique visitors clicked the most
I adjusted the viewport accuracy and tested it on different screens. Depending on the adjustment, the heatmap may or may not show on certain screens. I guess this feature was so that you can have an accurate view of the section clicked, especially on really large screens.
Clickmaps: Detailed Click Data
If you select the toggle button for clickmaps and put them on, it will show you the number of times a call-to-action button was clicked with detailed info once you hover on it.
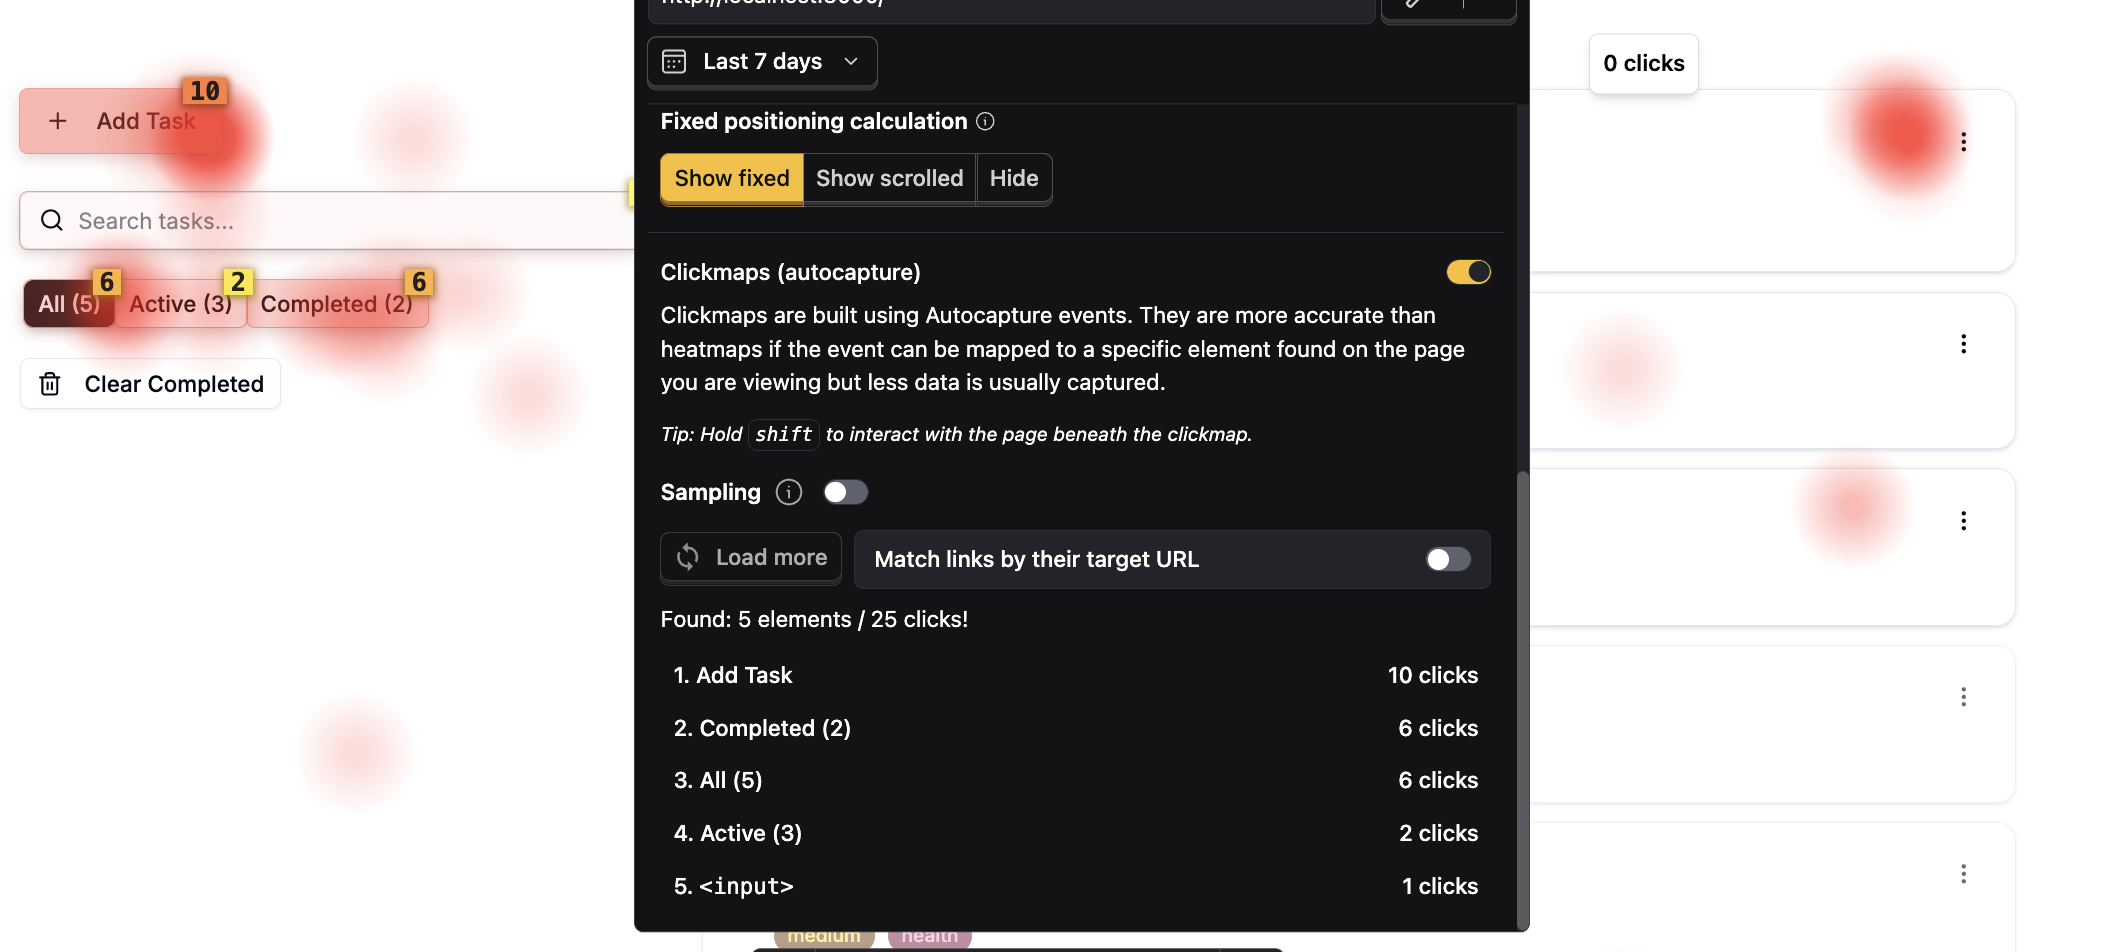
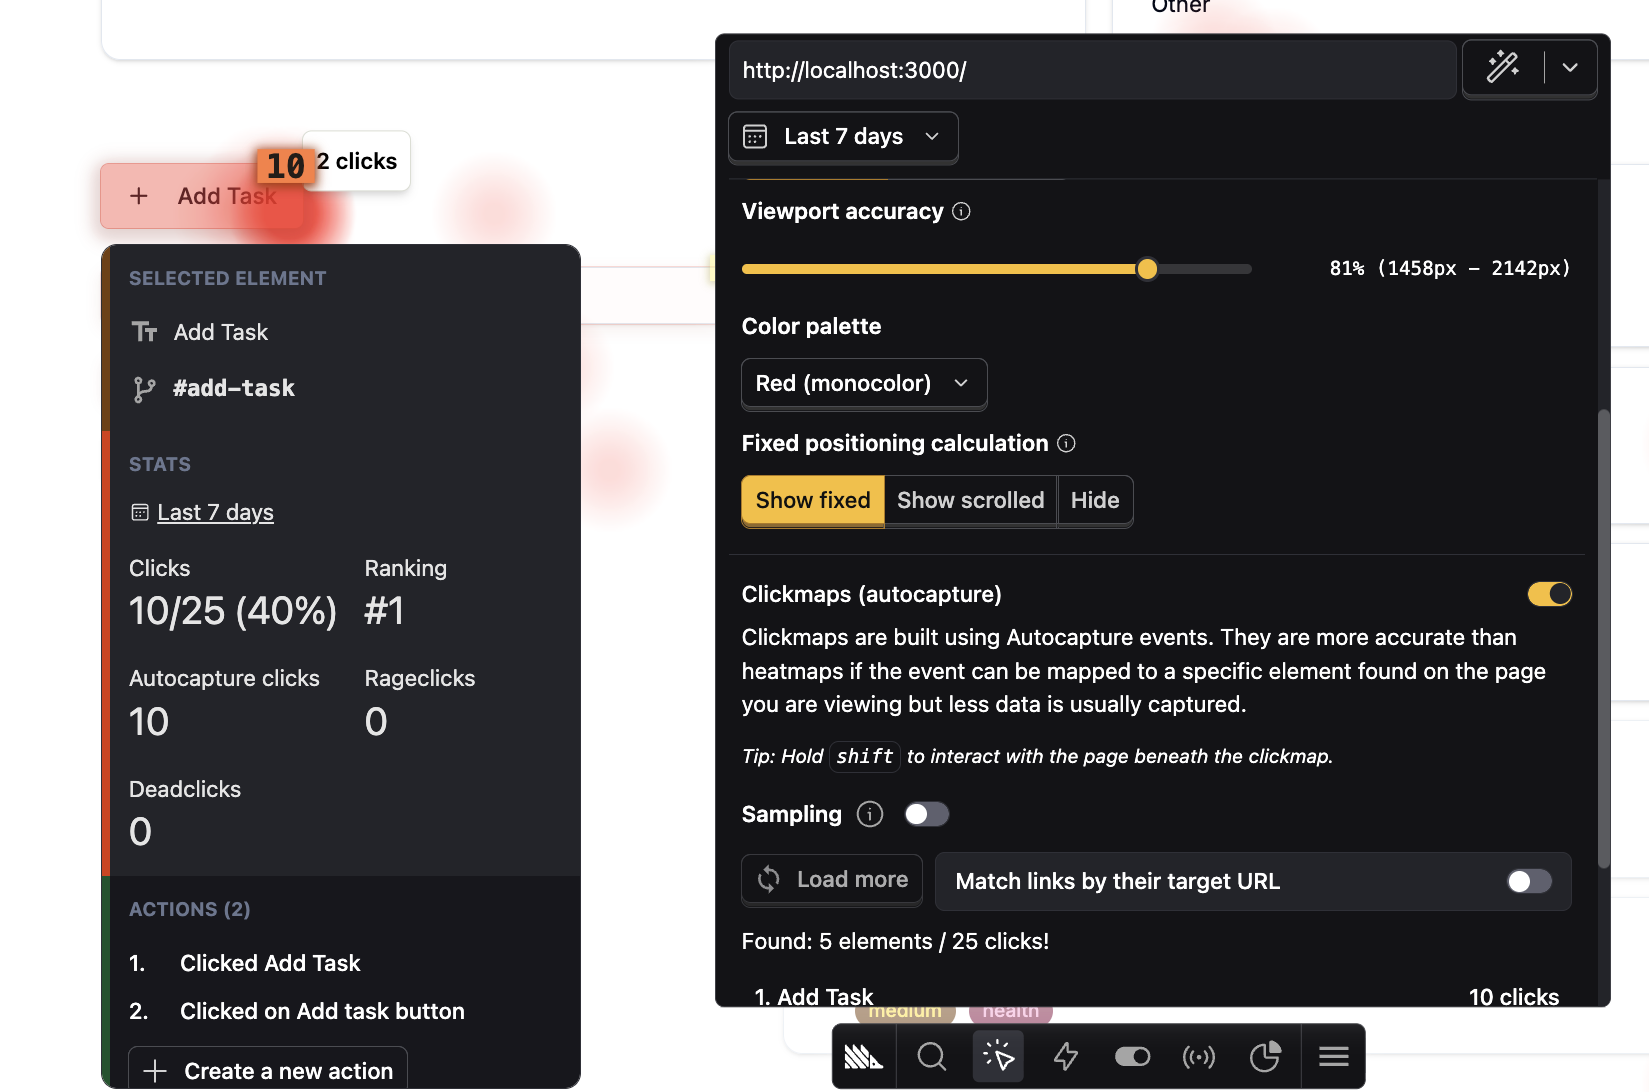
This was actually useful - I could see exactly which buttons got the most attention.
Actions: Where Things Got Confusing
I proceeded to the Actions icon, where I was prompted to create an action.
I won't lie, this section stressed me. I found it difficult to understand what it was and what I should look for, even after reading PostHog's documentation more than twice.
Anyways, I will give you the gist.
Creating My First Action
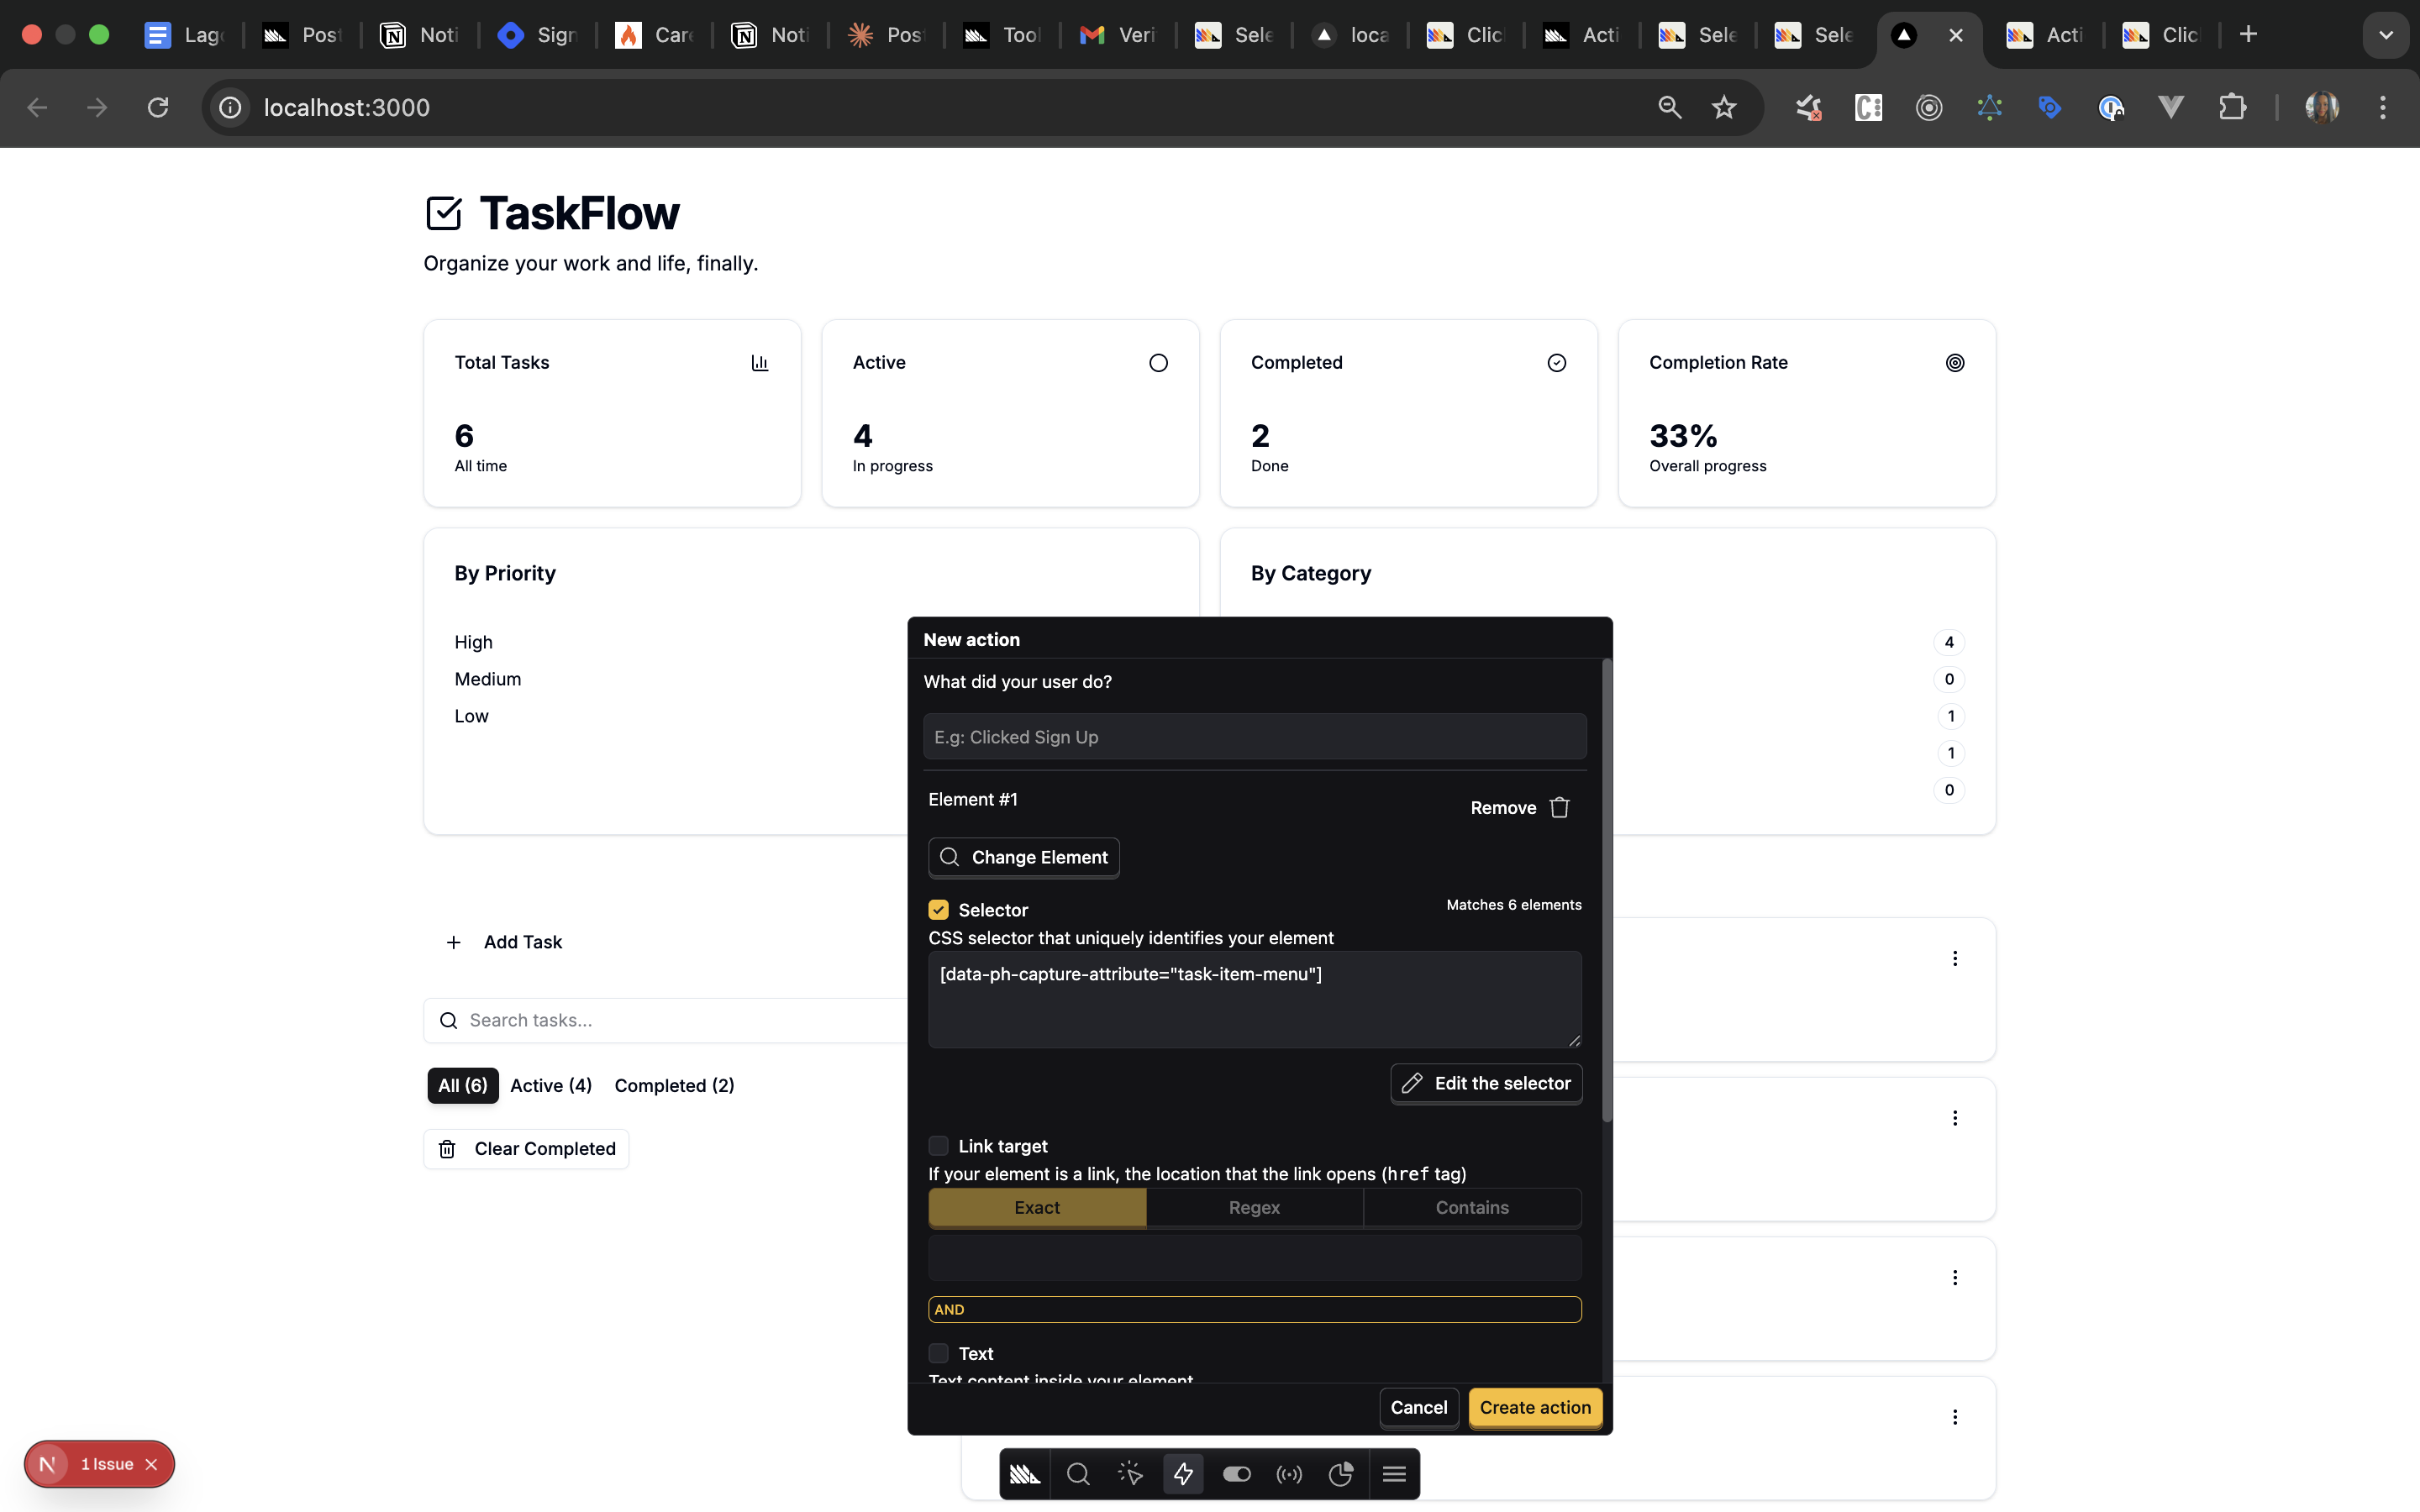
I started creating an action by selecting an element (remember, PostHog highlights elements you can select).
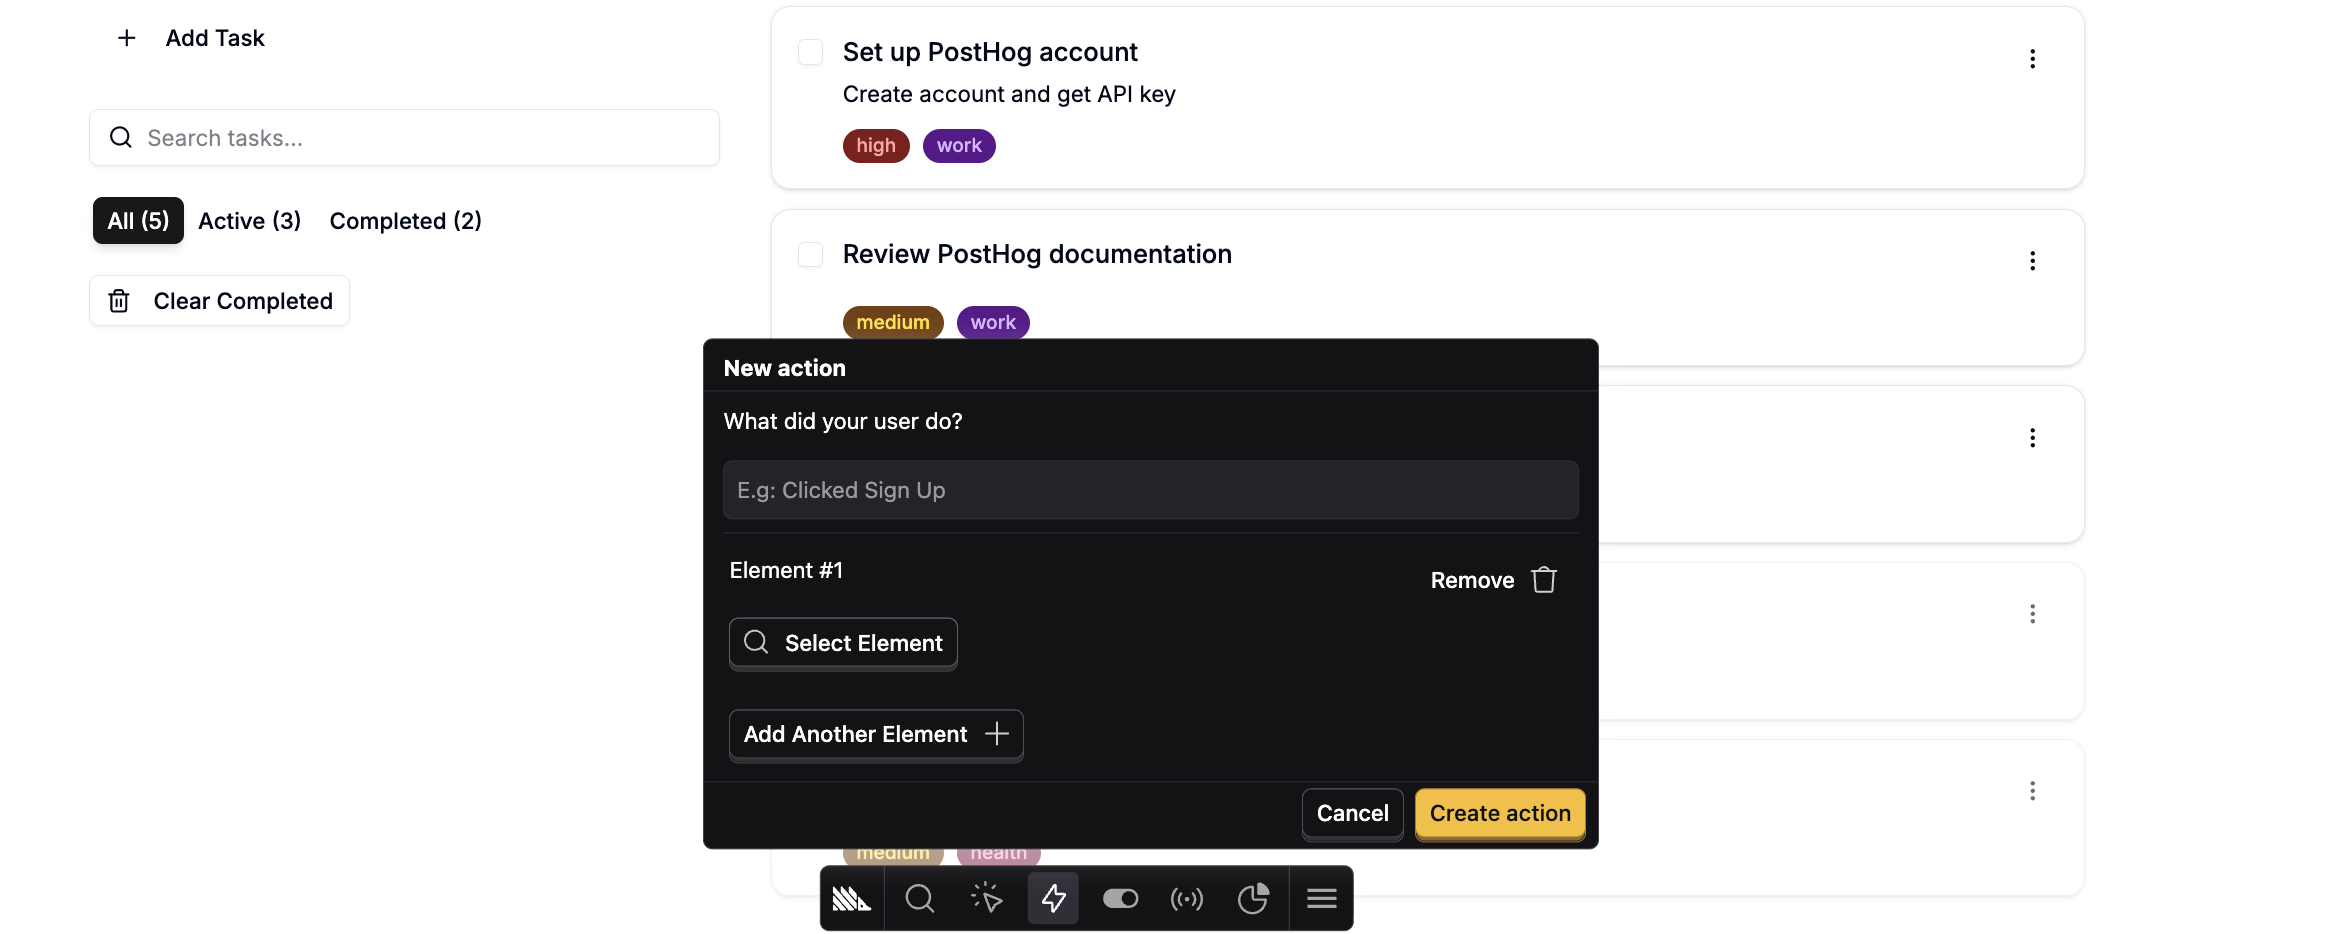
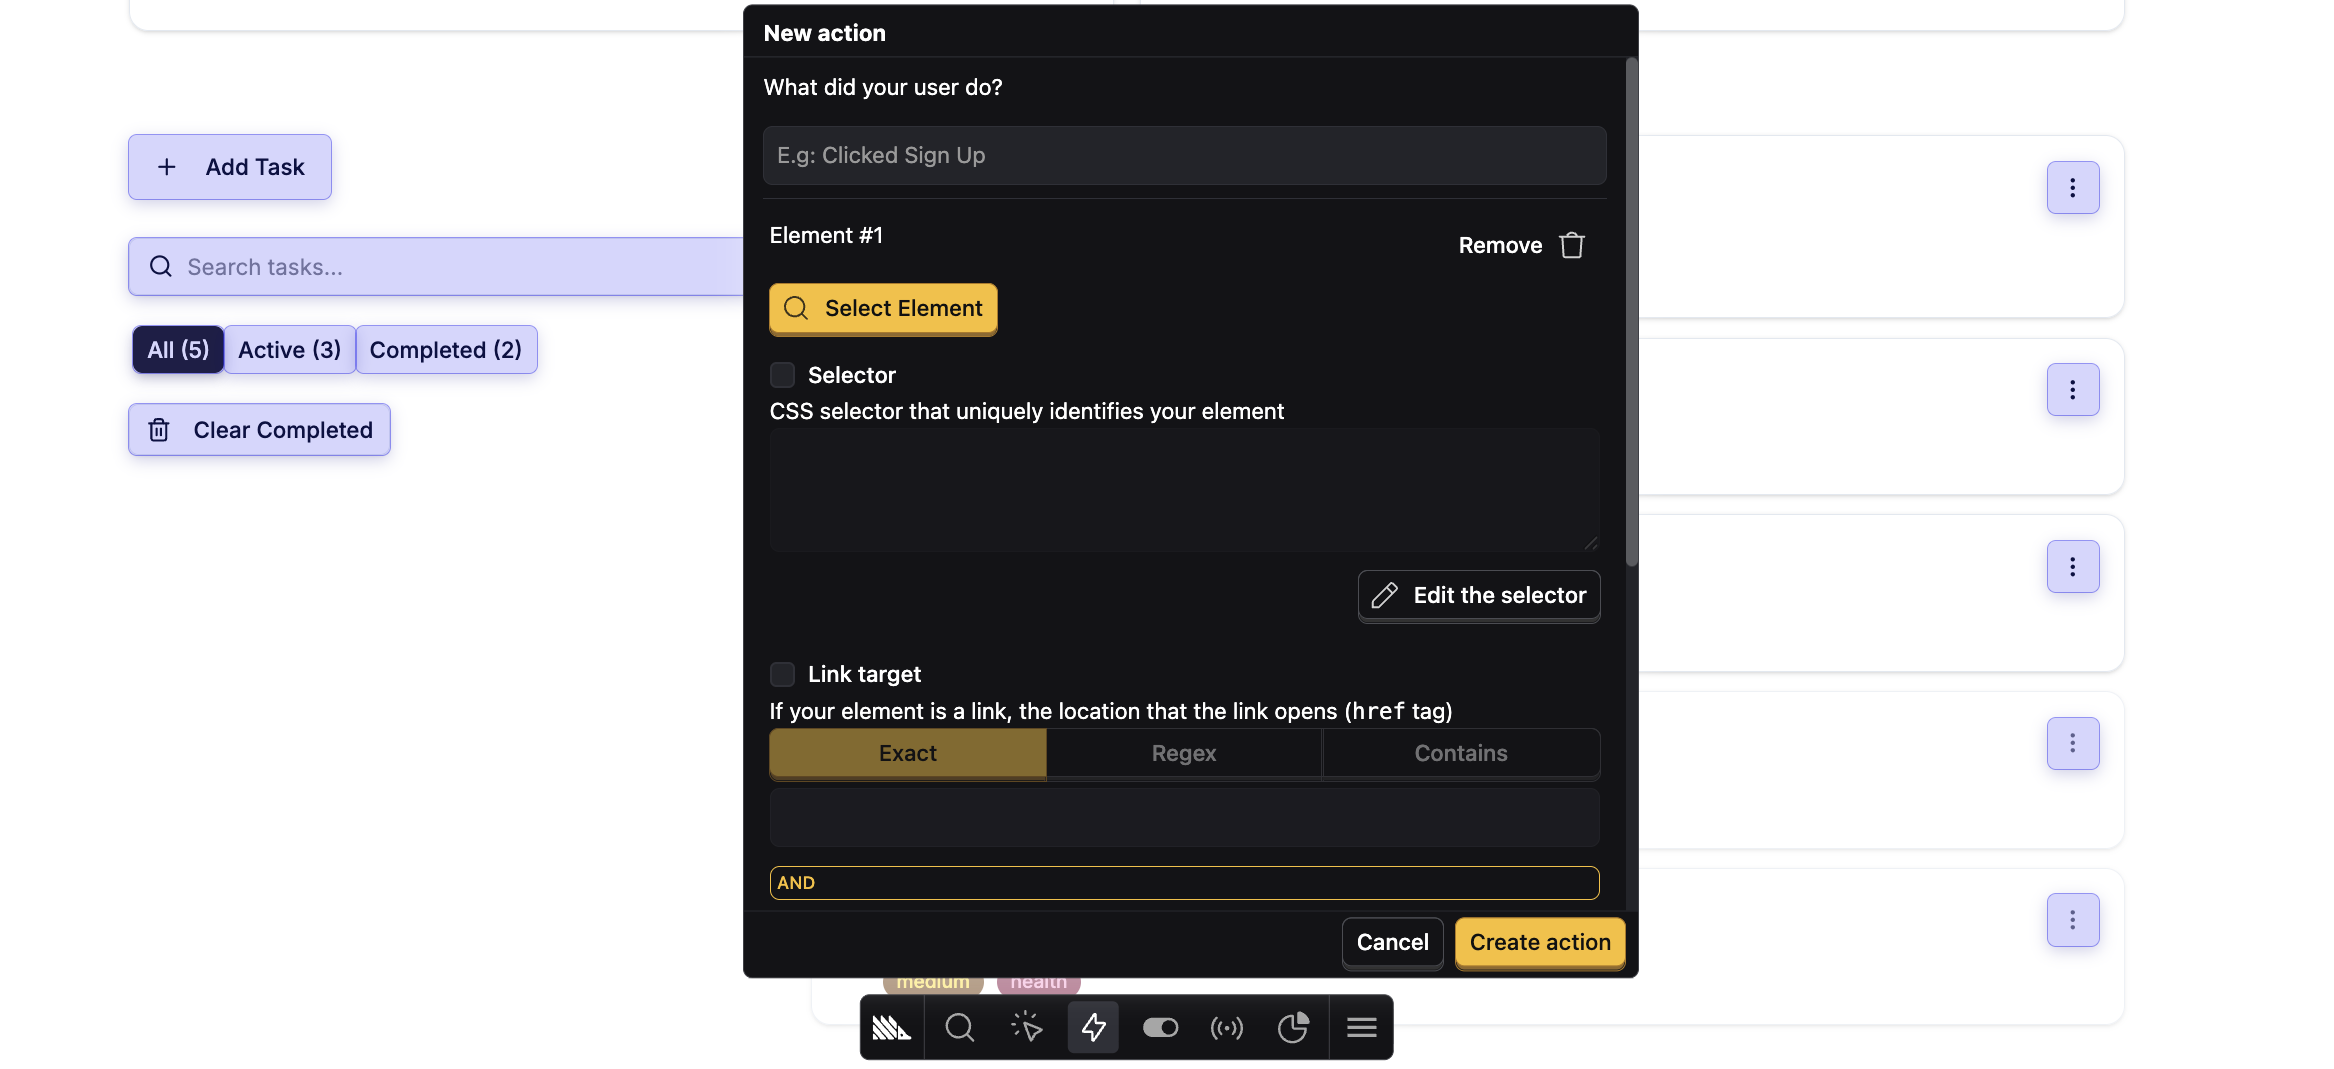
Then I filled the form with a description stating what I wanted my action to do after selecting the element, then created the action.
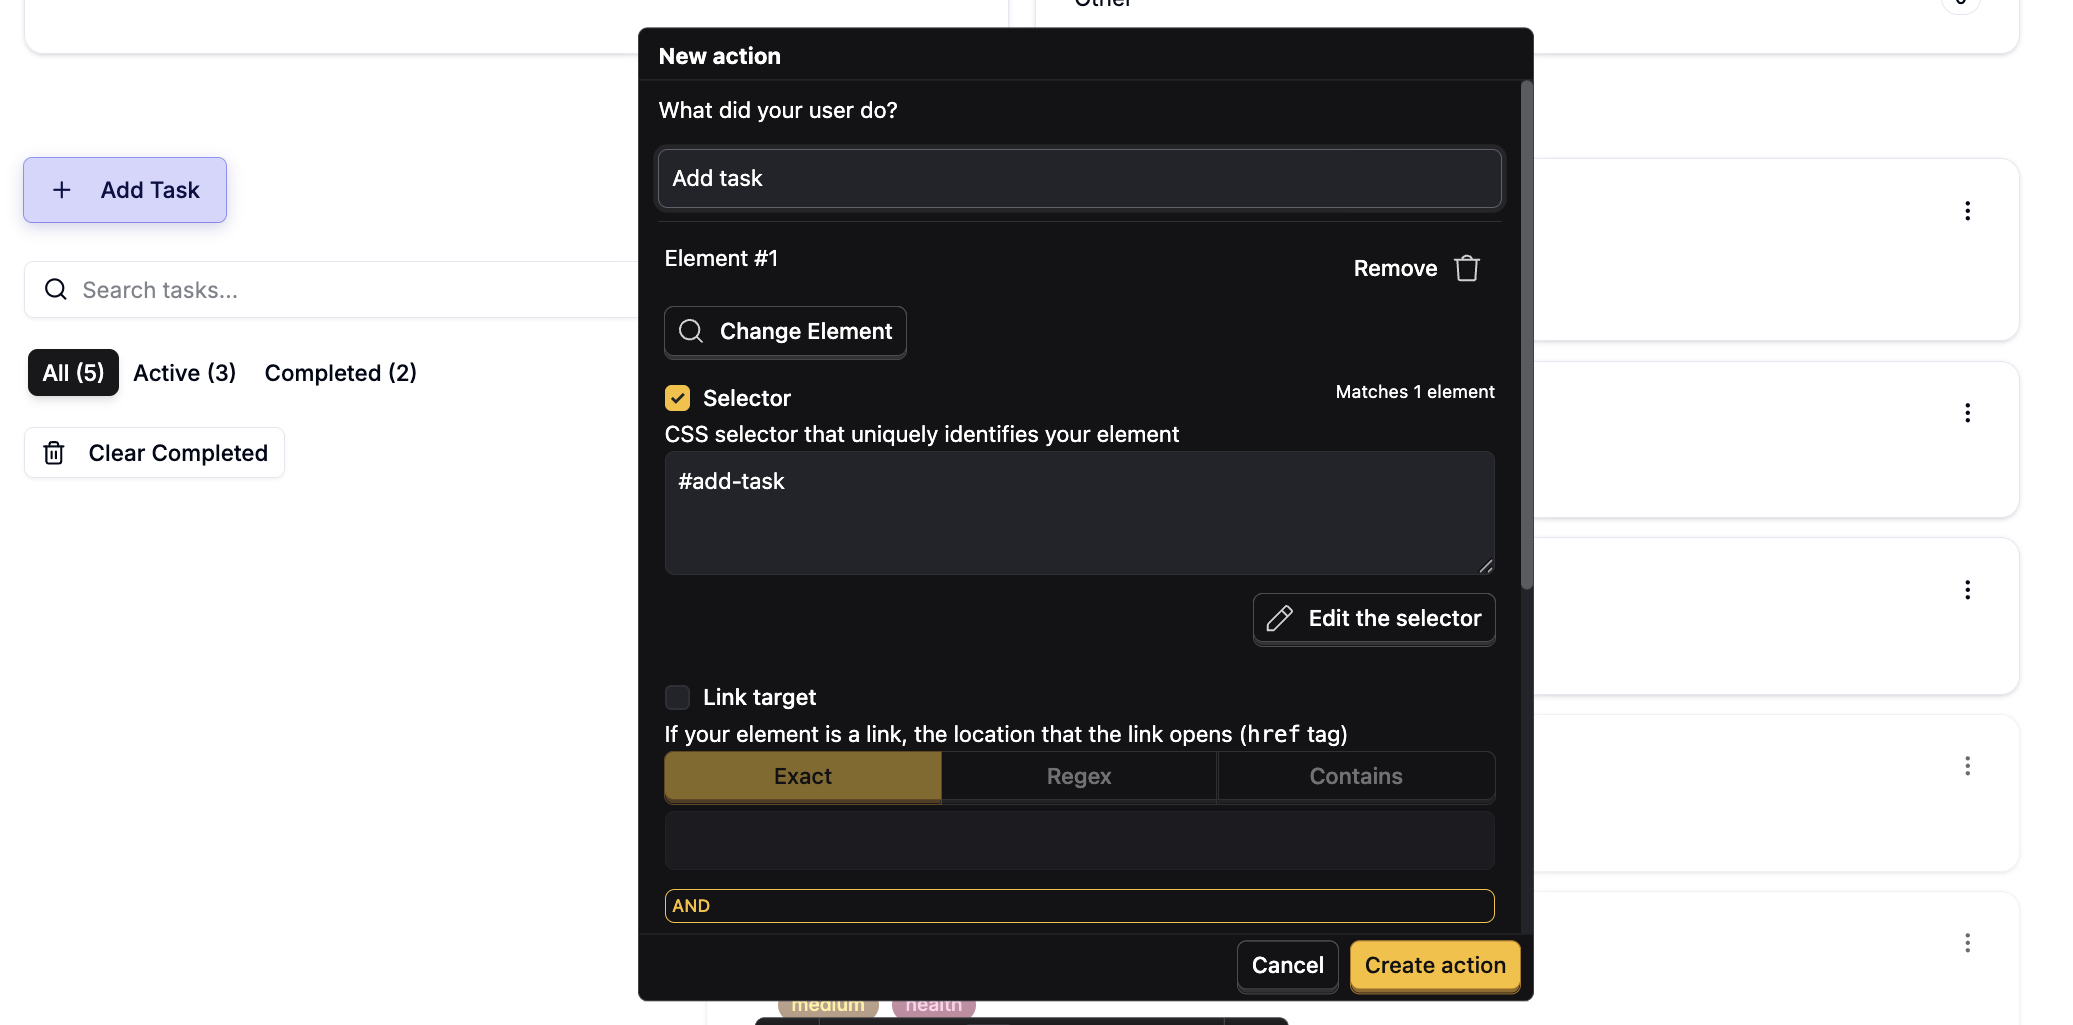
The Matching Queries Problem
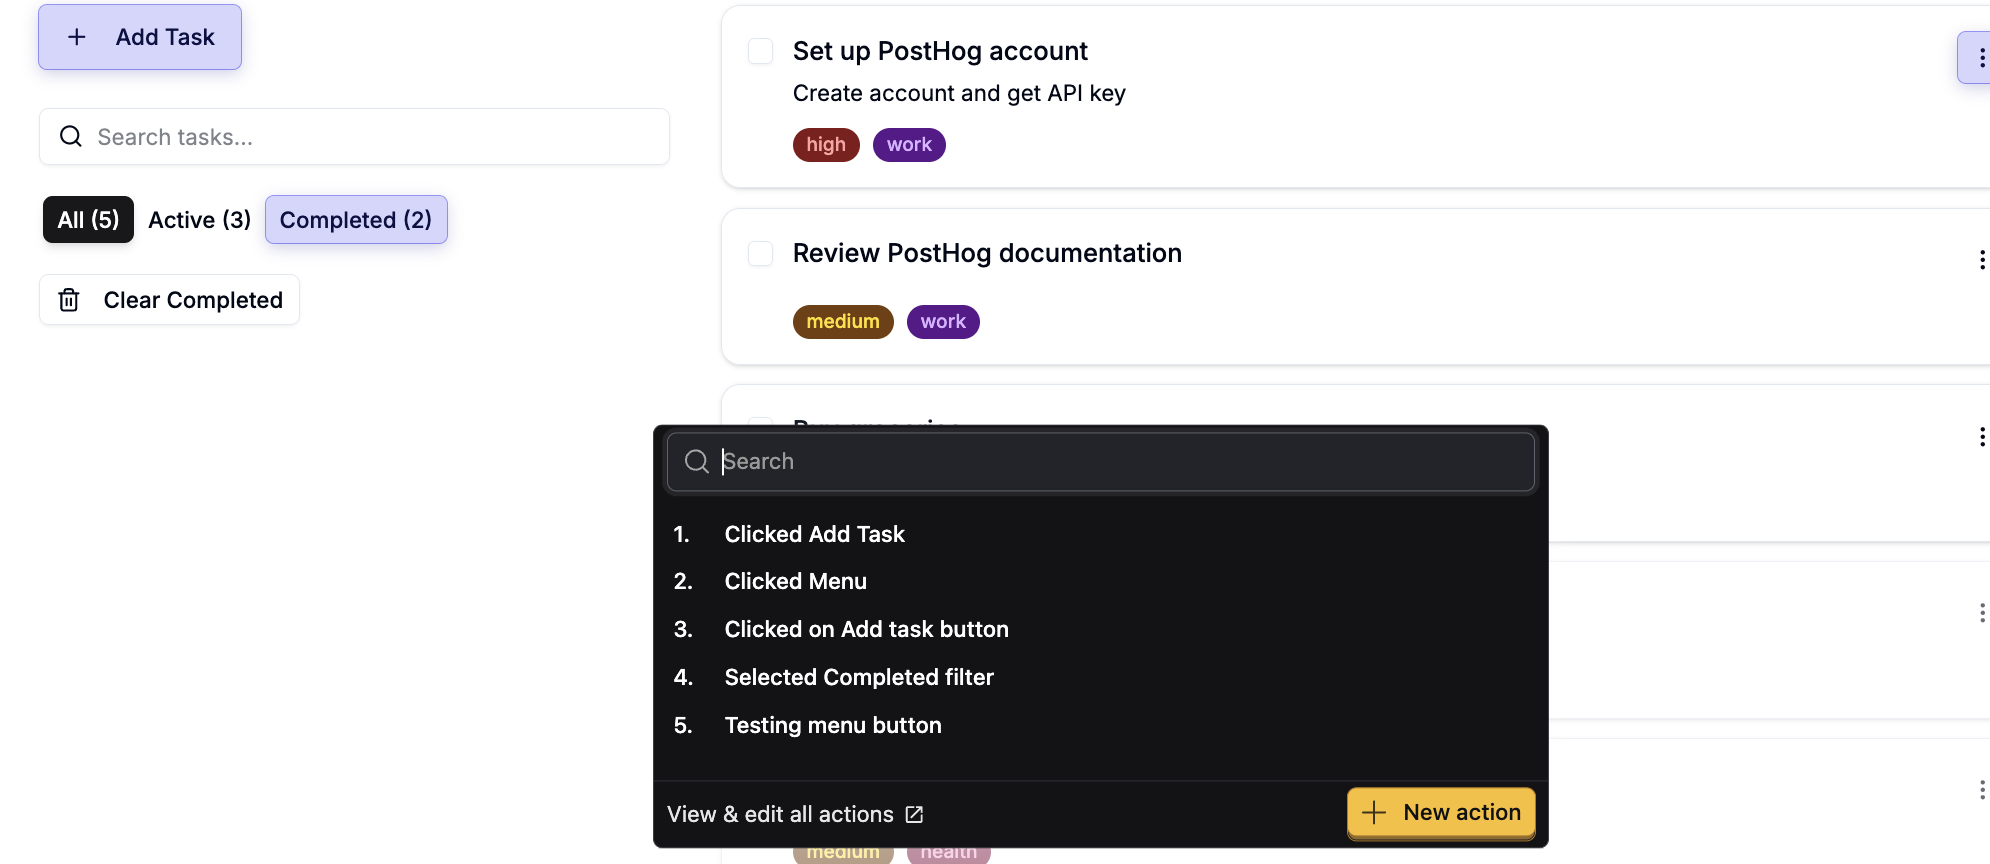
This led me to see a list of actions I had created. The reason why you can see a lot of actions in this image is because this section was doing my head somehow. I created the action and clicked on PostHog's call-to-action button to view the actions, which led me to PostHog's app.
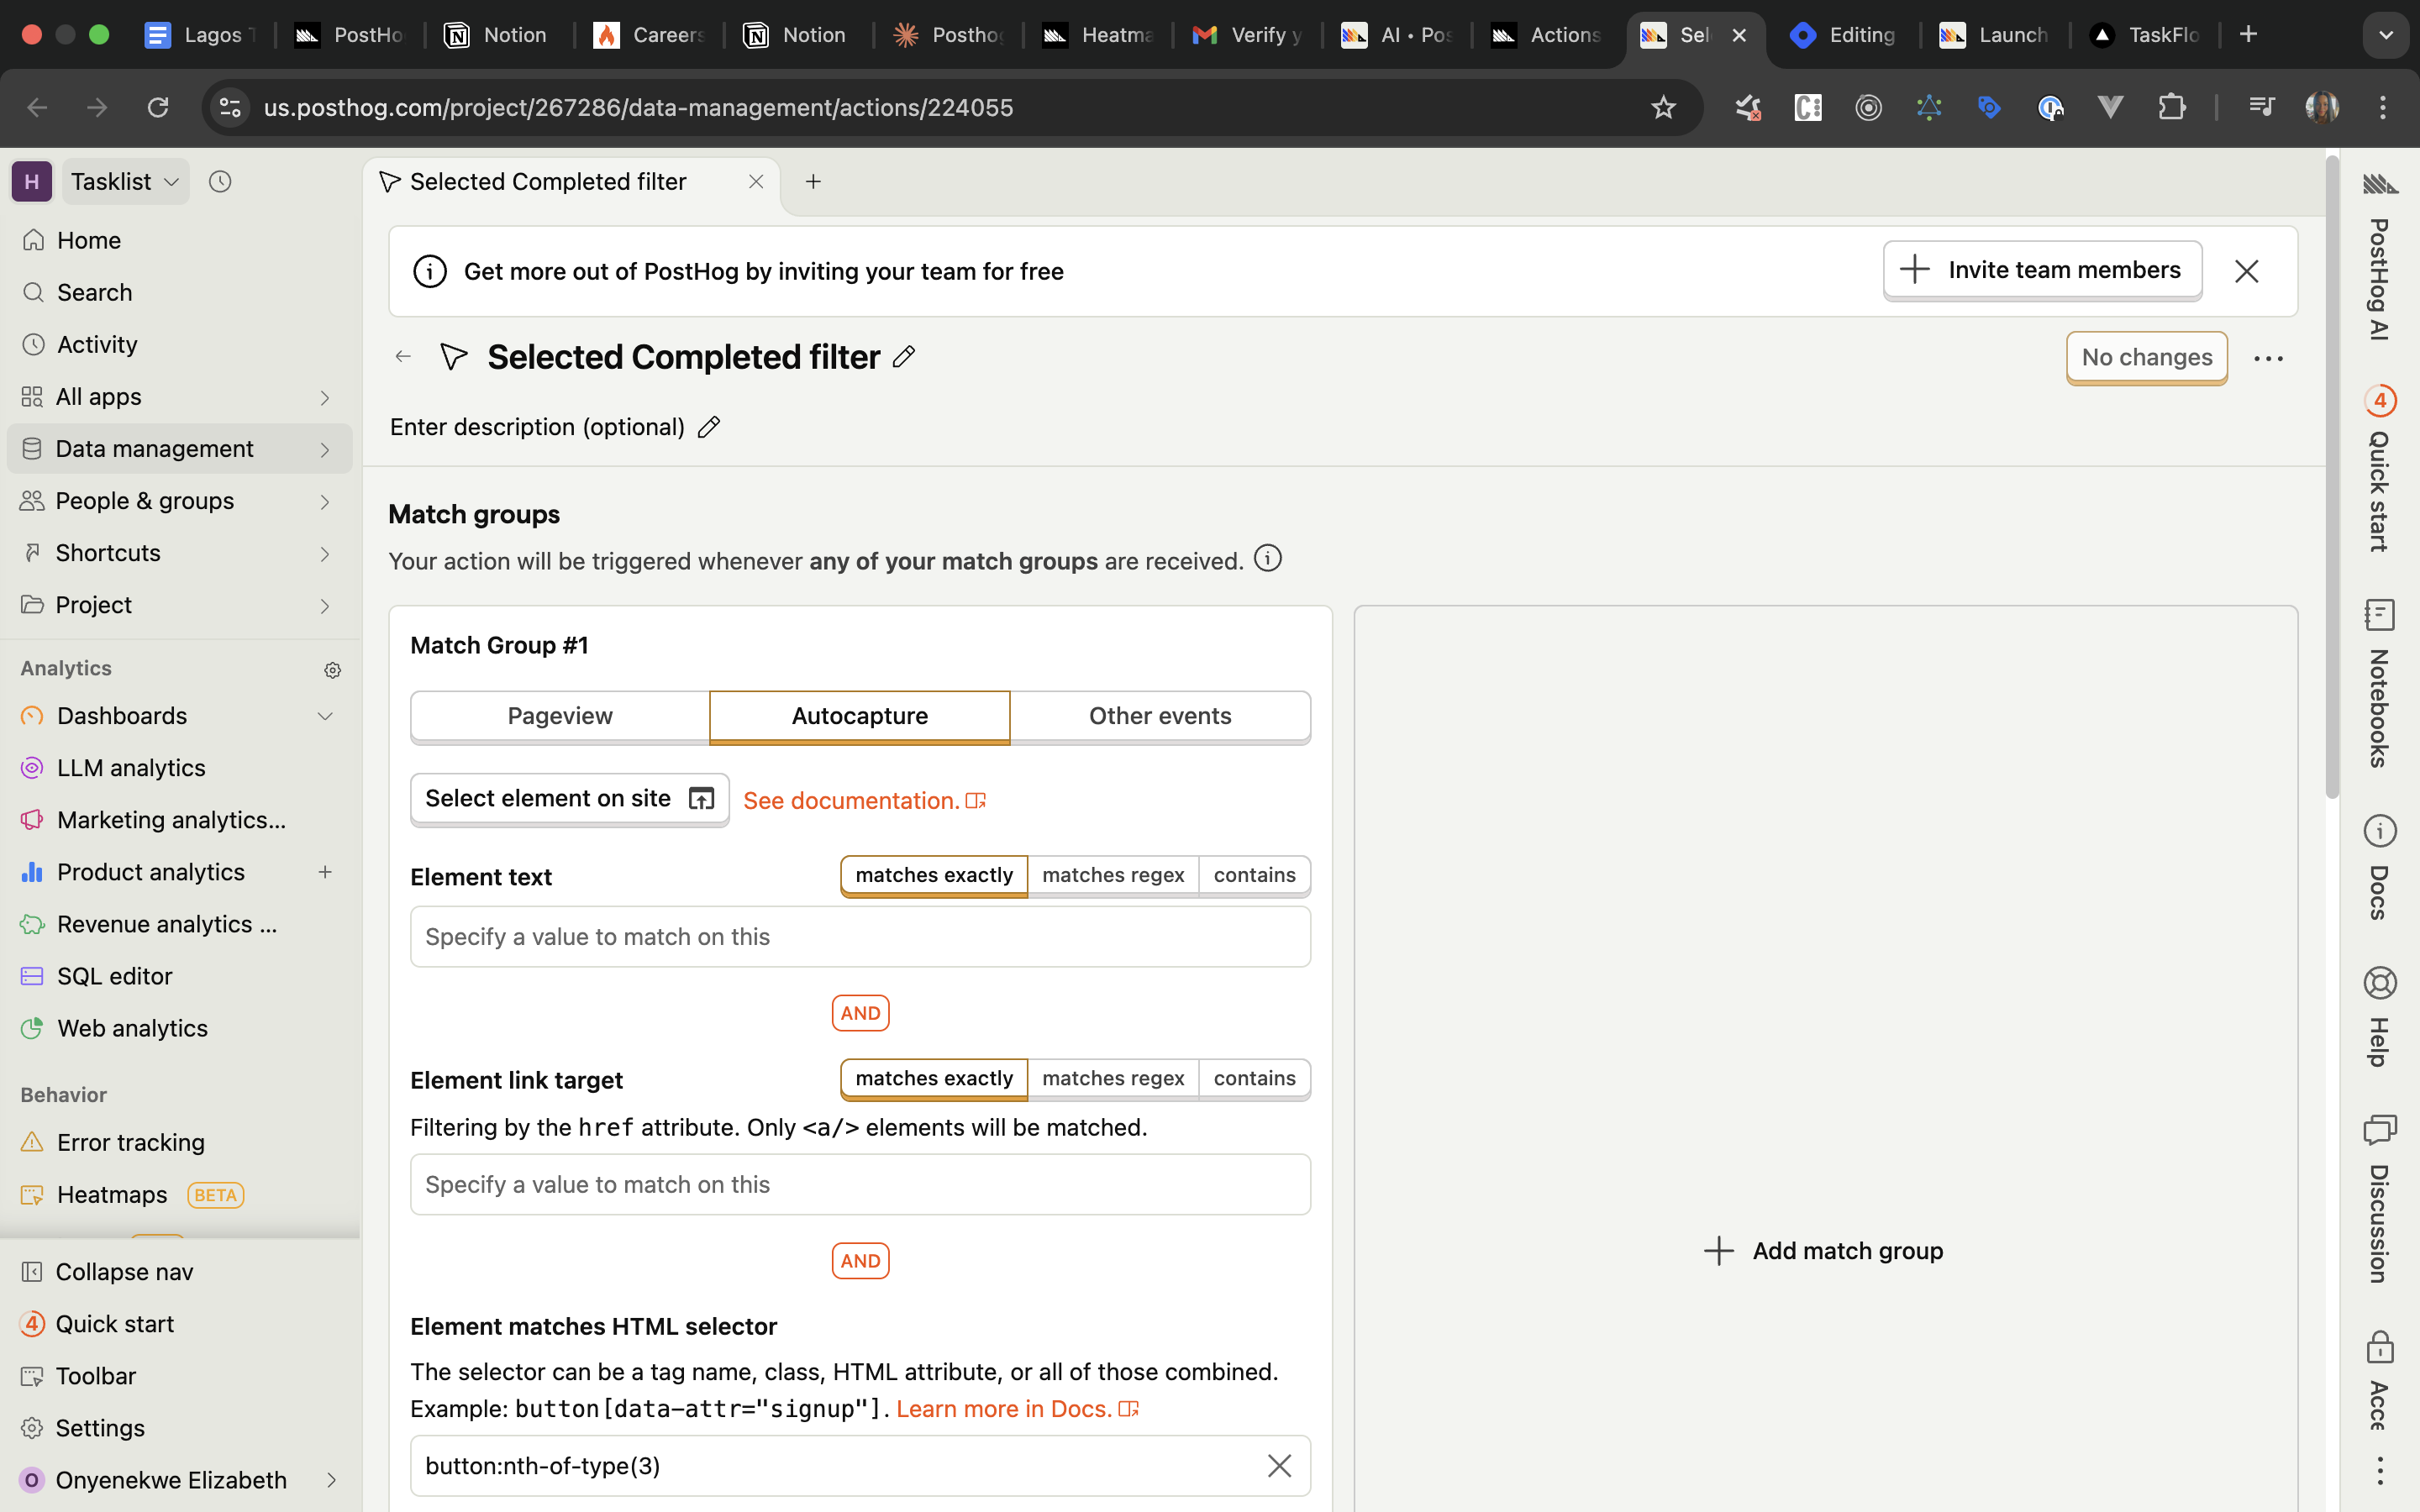
When I opened the action, I saw where I could edit it, then I saw how I could connect the action to different apps to monitor users and notify me, and I saw "no matching queries," which was quite confusing.
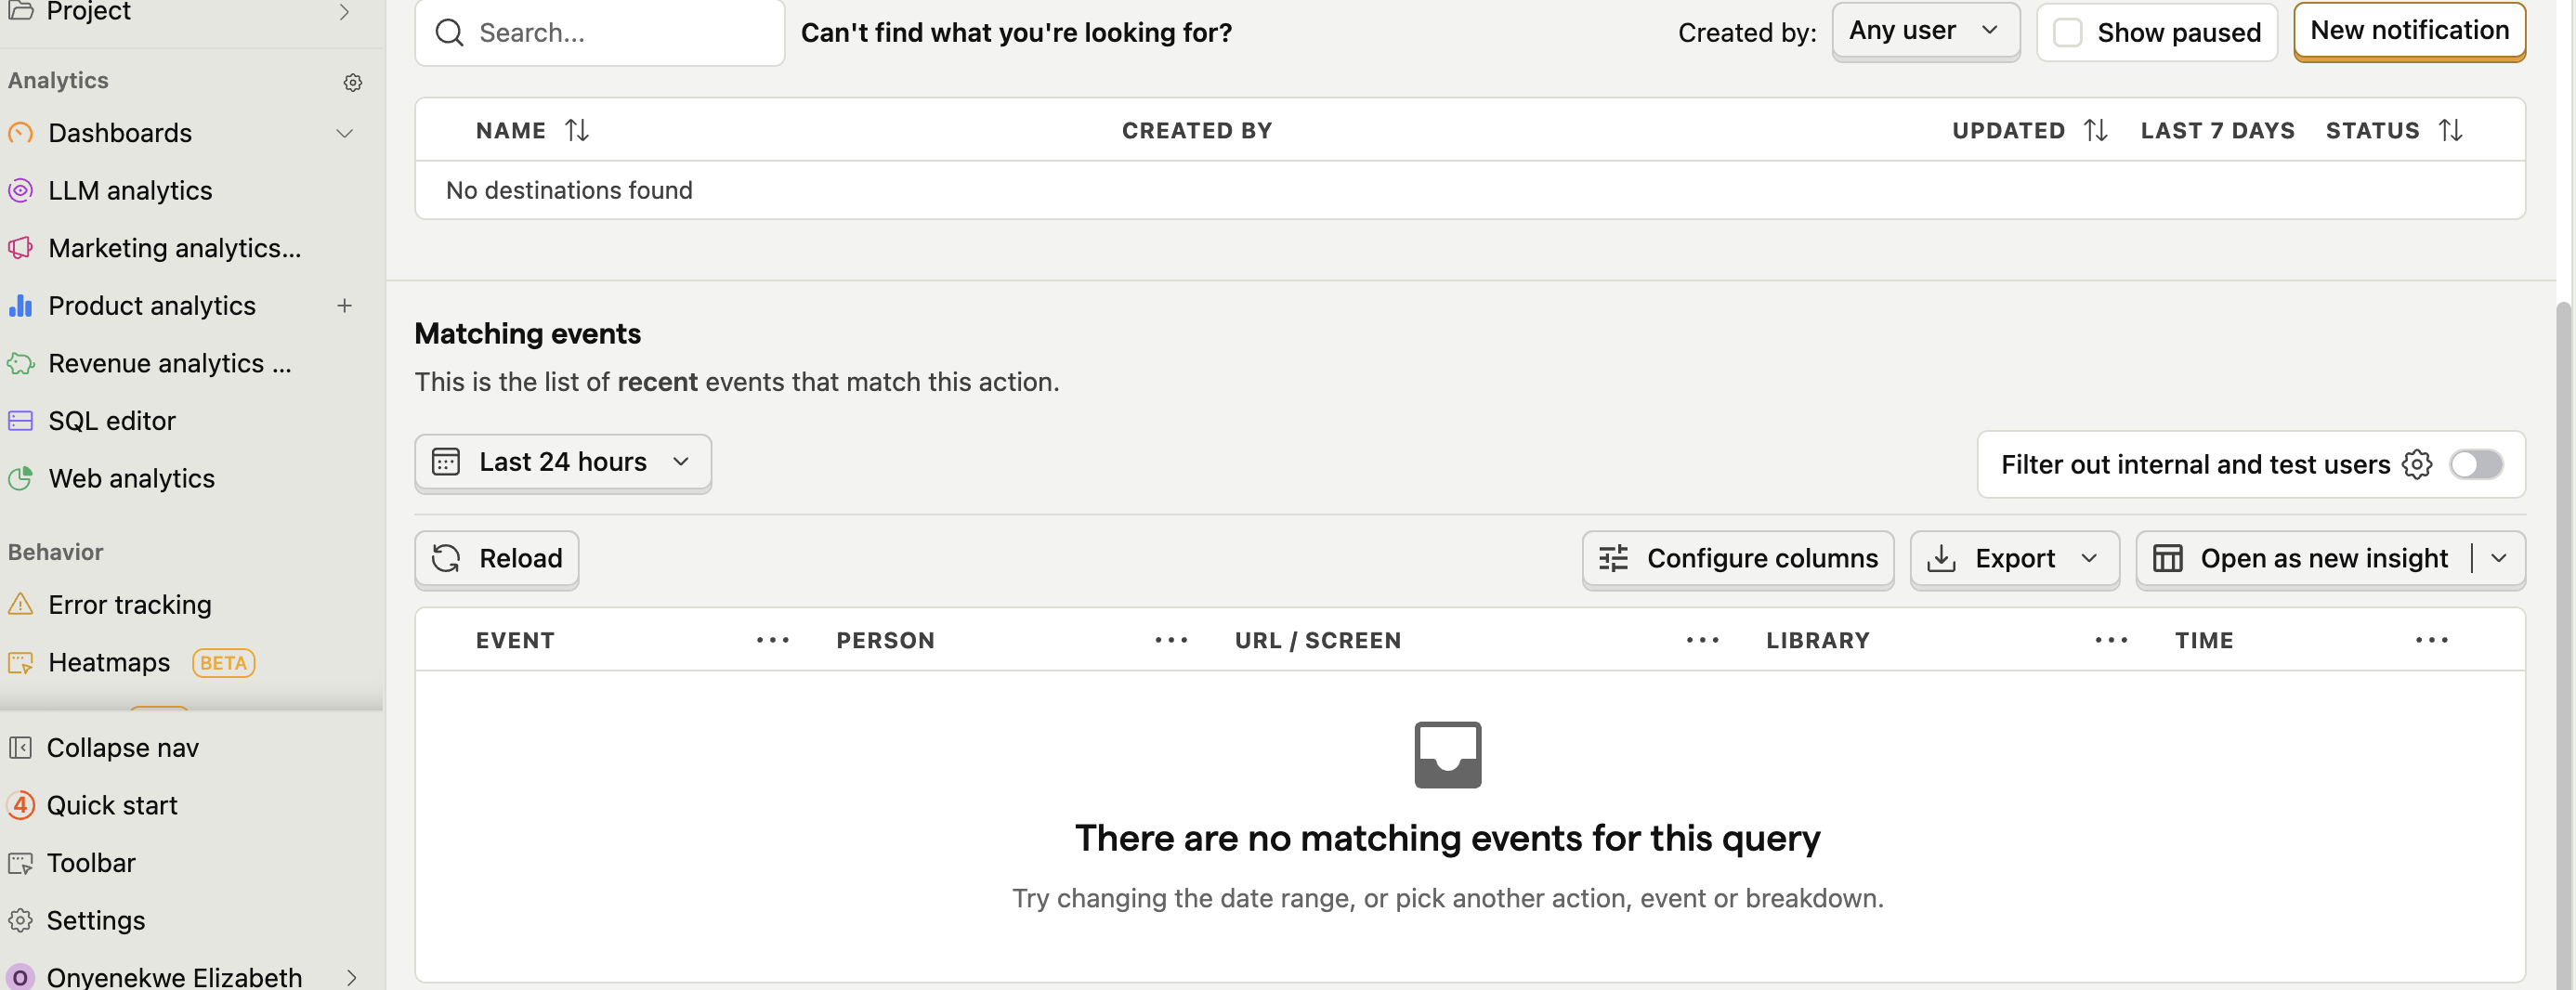
As a new user, I didn't know what to expect. I thought it's because I had probably not performed an action and went back to my TaskFlow app to play around where I created an action, and still nothing happened.
What I Tried (Everything)
I looked at their documentation and went to my codebase to:
Edit data attributes
Reopen the action
Create new actions
Edit the CSS selector by selecting the data attributes I created directly from the toolbar
Still nothing.
I went over to the PostHog app and was just selecting everything and still nothing. Omo, I was just rigmarolling everywhere, it was so annoying.
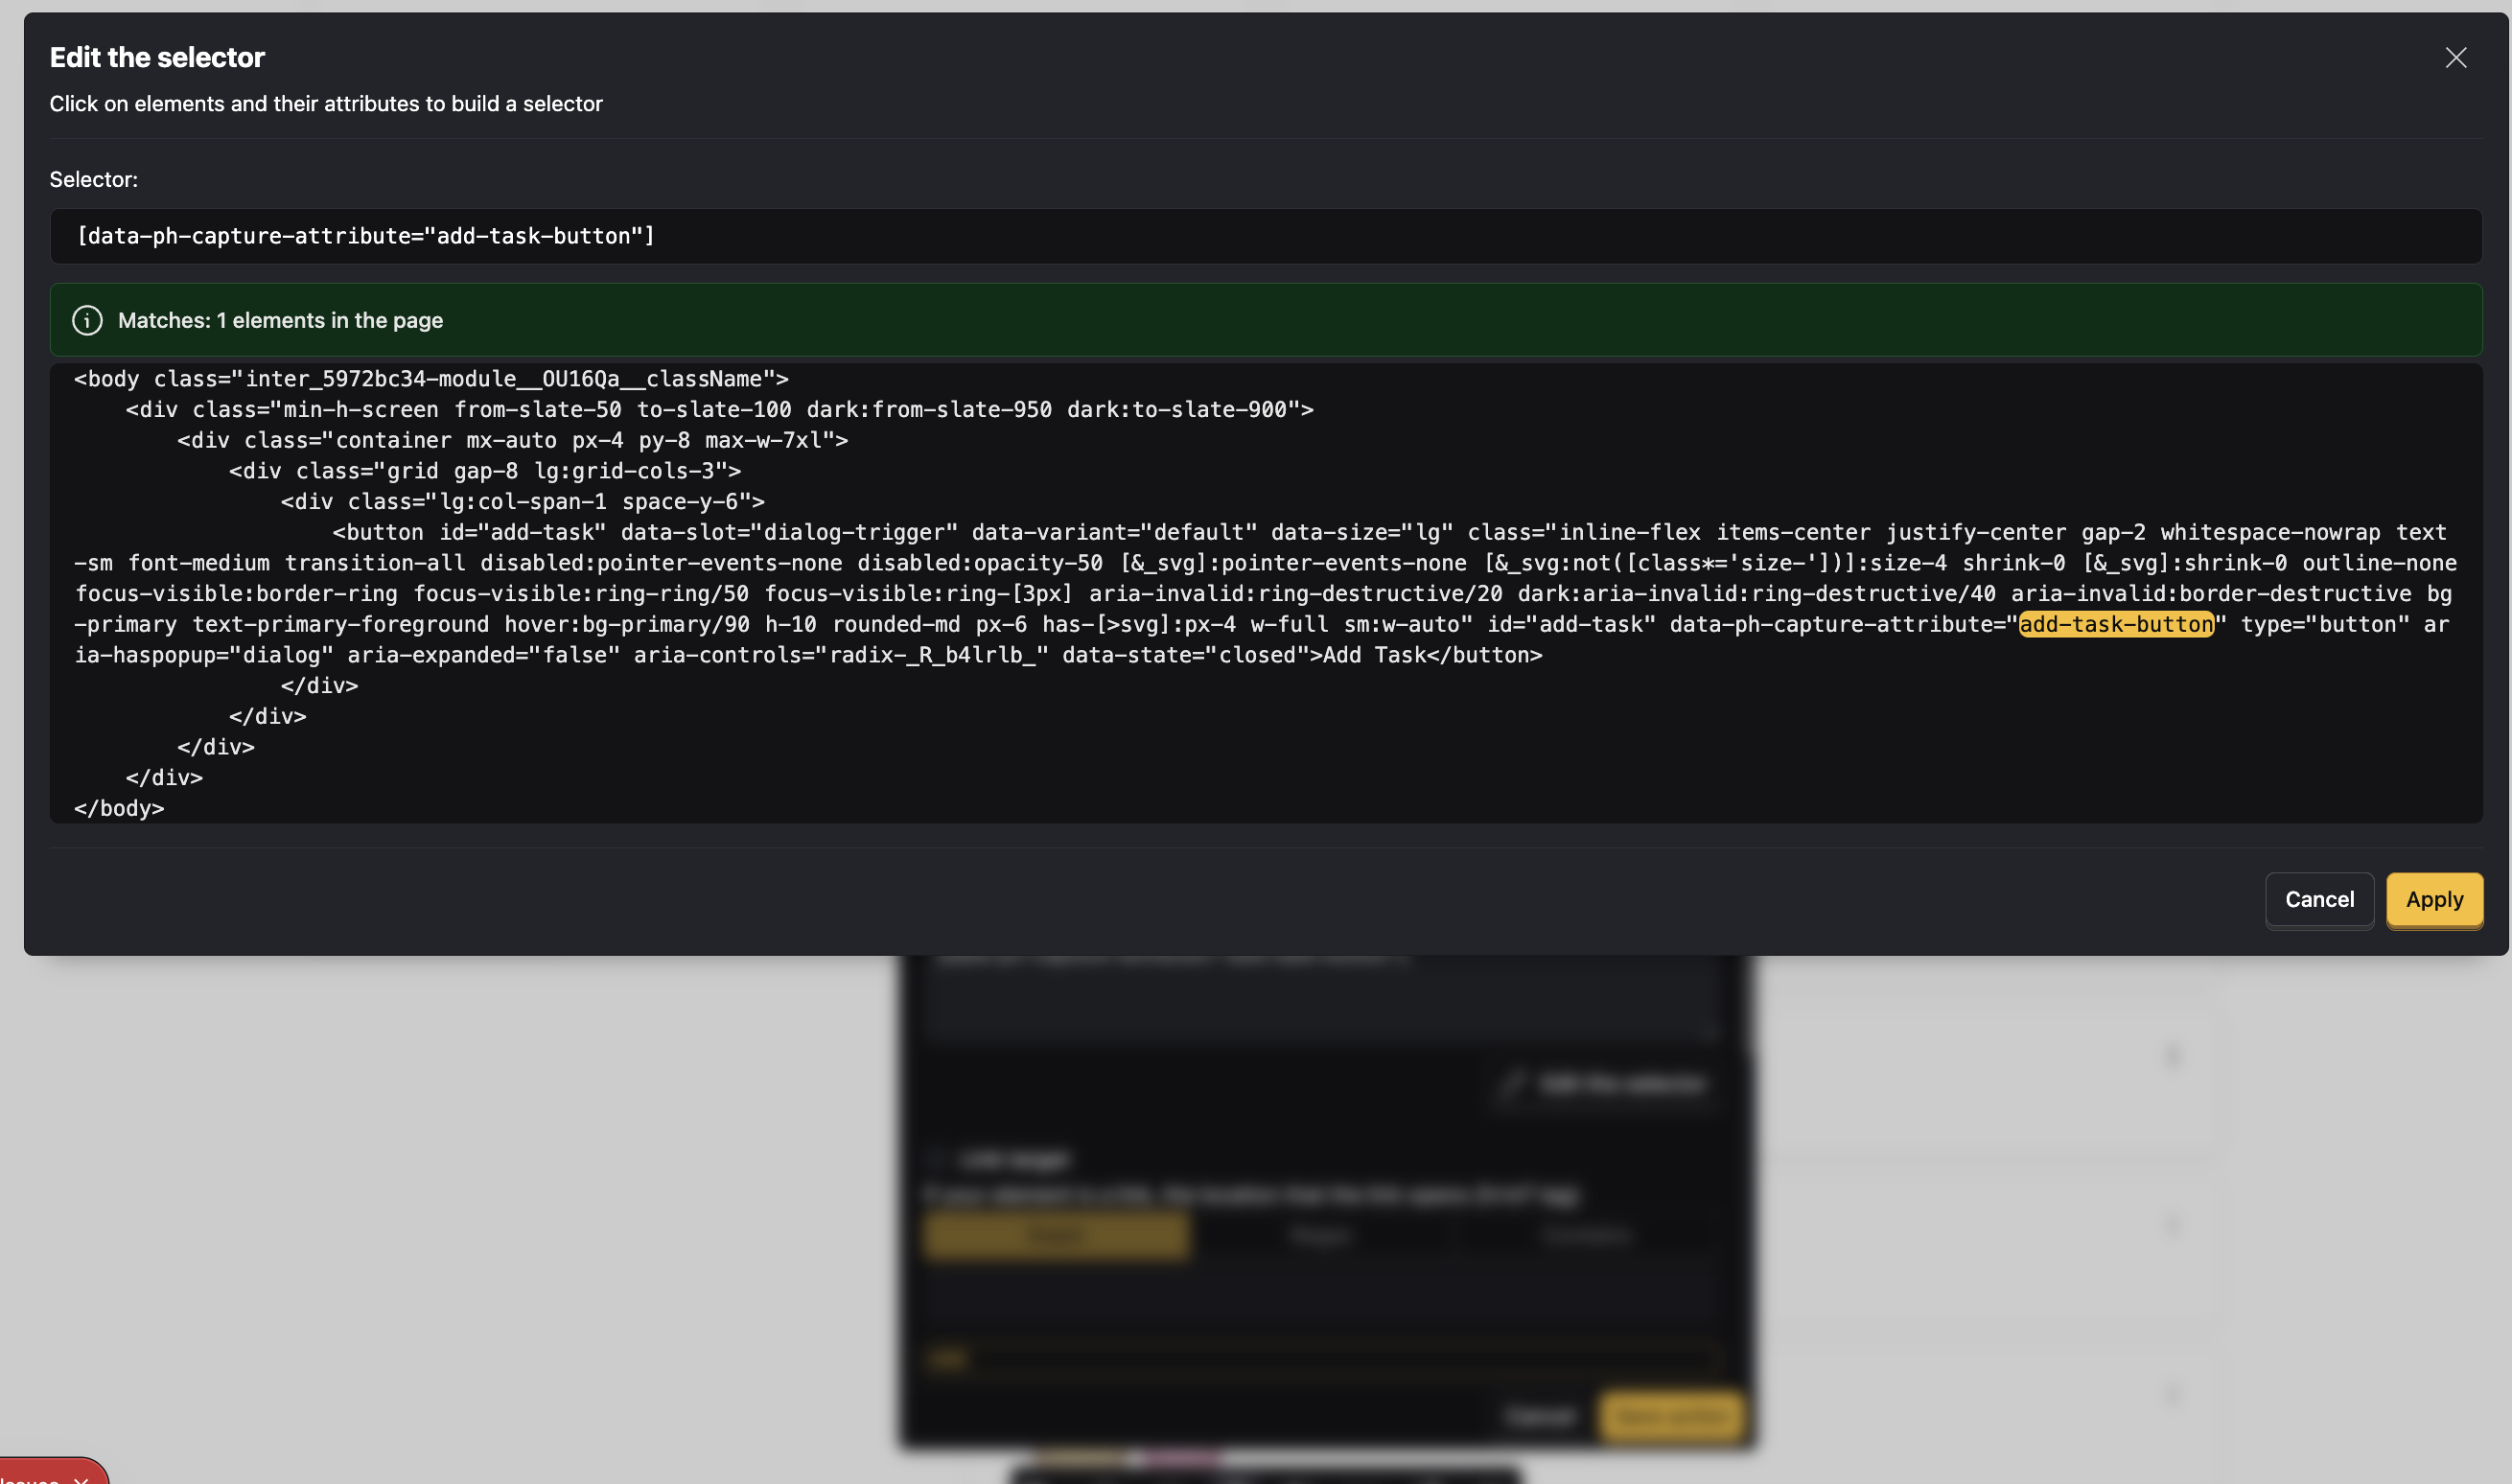
When It Suddenly Worked (Sort Of)
Then all of a sudden, some events showed up in the matching query for 2 of the actions and I don't even know what I did.
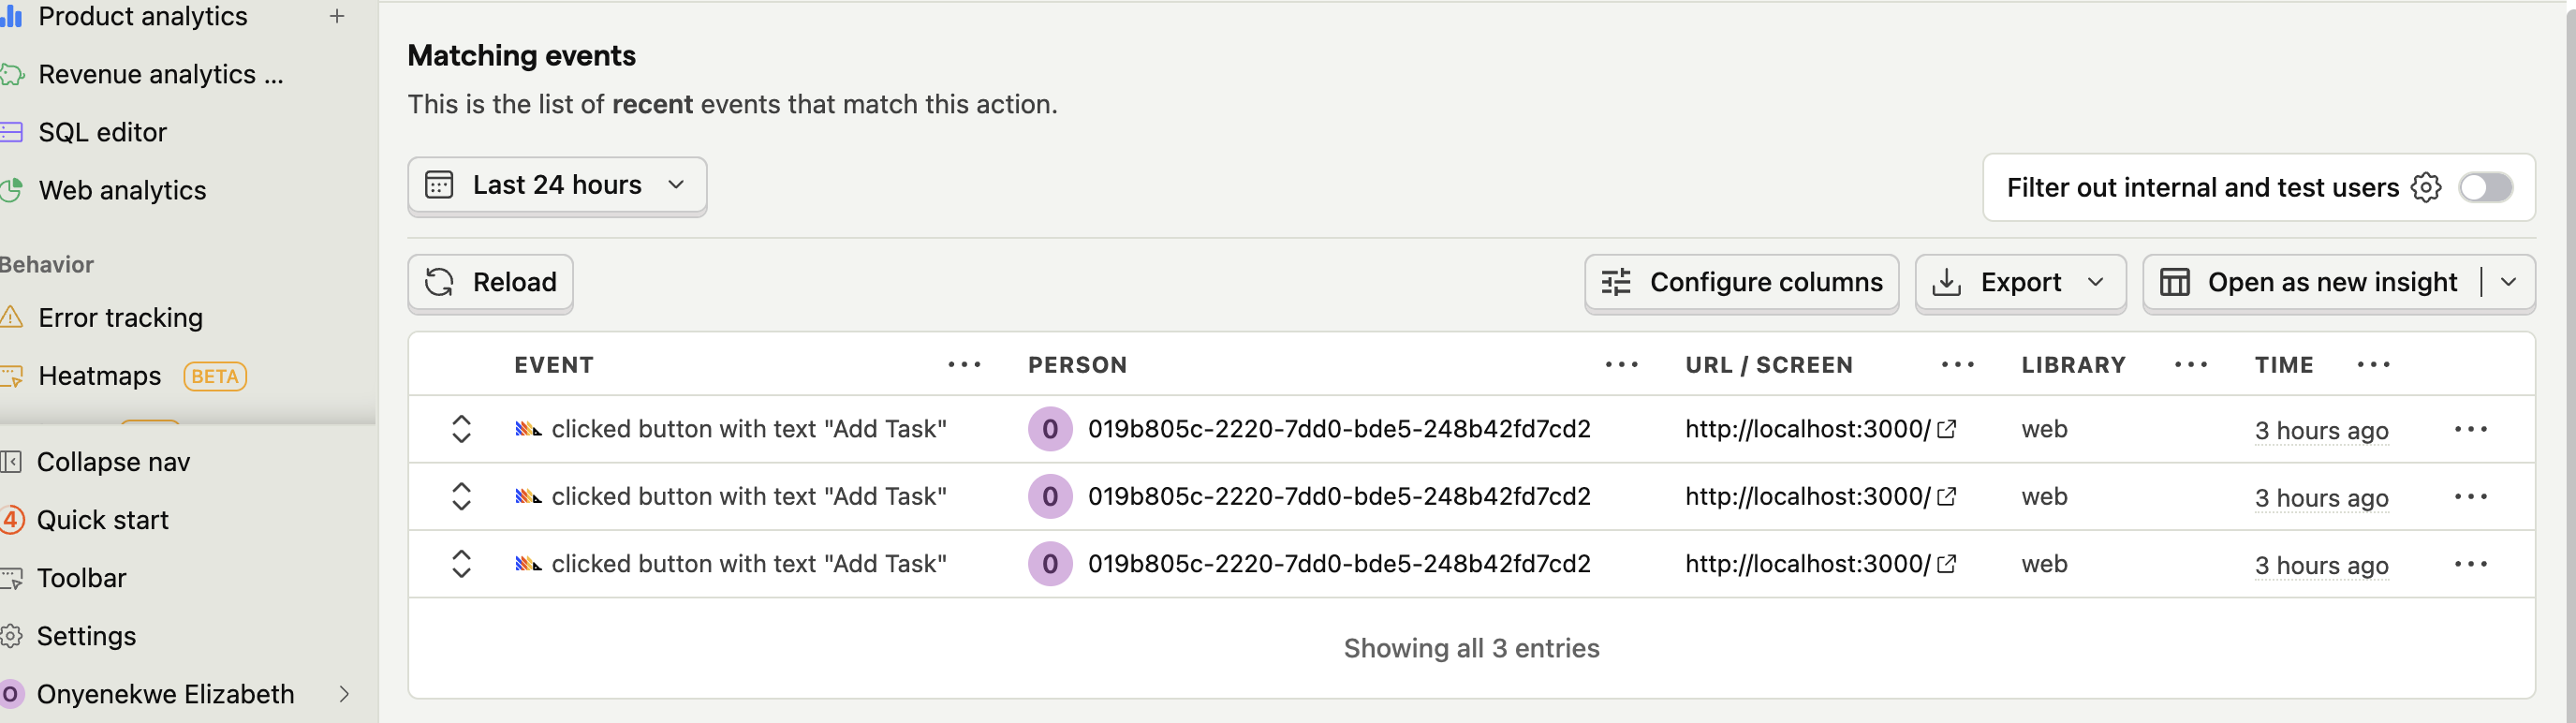
These events were information and a screen recording of what happened to the users when they were using that part of the TaskFlow app. The other actions still have no events, but I gave up on searching.
Question for PostHog: Am I doing something wrong? Or is there an amount of time before events appear in the matching query section of your app? It will be nice if you could provide a clearer description on how to get this started for new users like us.
The Other Toolbar Features
After the back and forth with Actions, I proceeded to the next icon.
Feature Flags
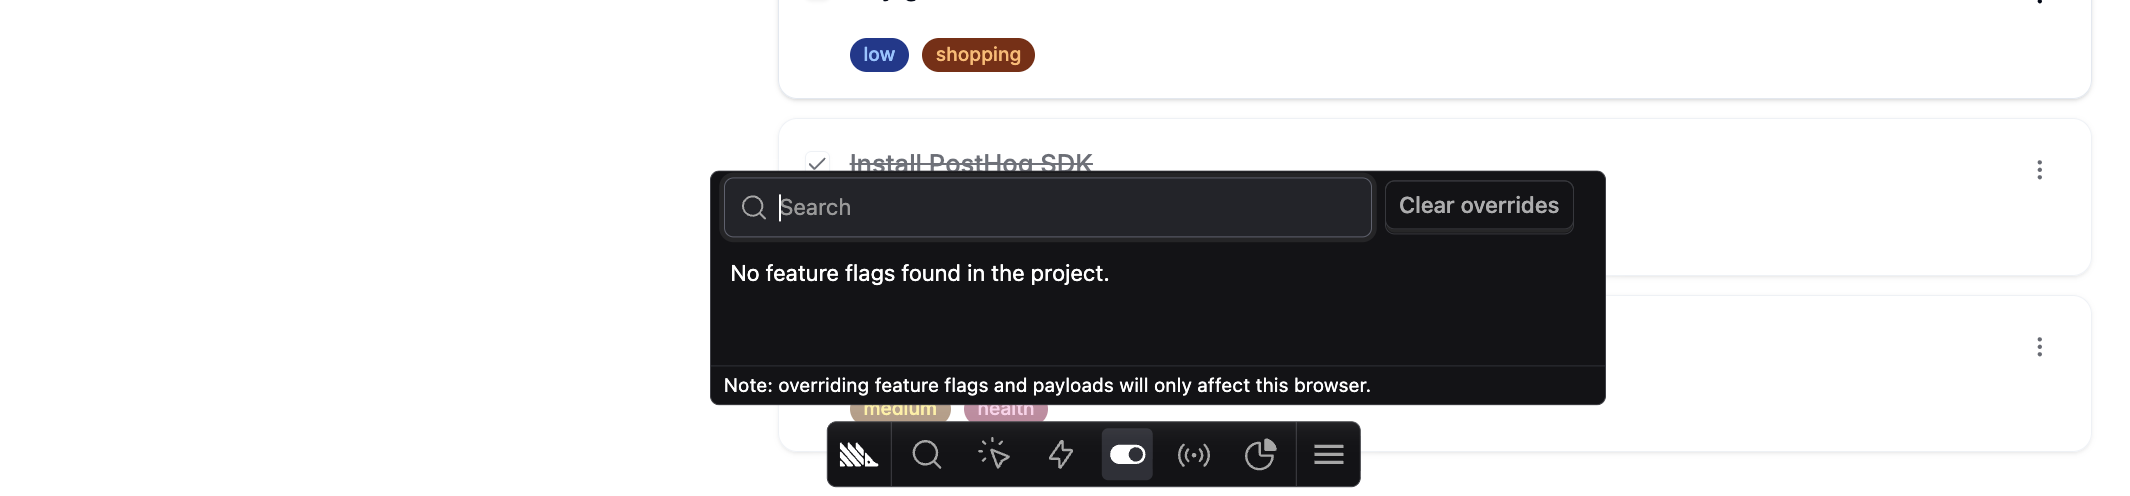
This was for feature flags and I do not know yet what this is for, but I guess we will find out as we go deeper in the series. For now, PostHog said the TaskFlow app had no feature flags yet.
Event Debugger
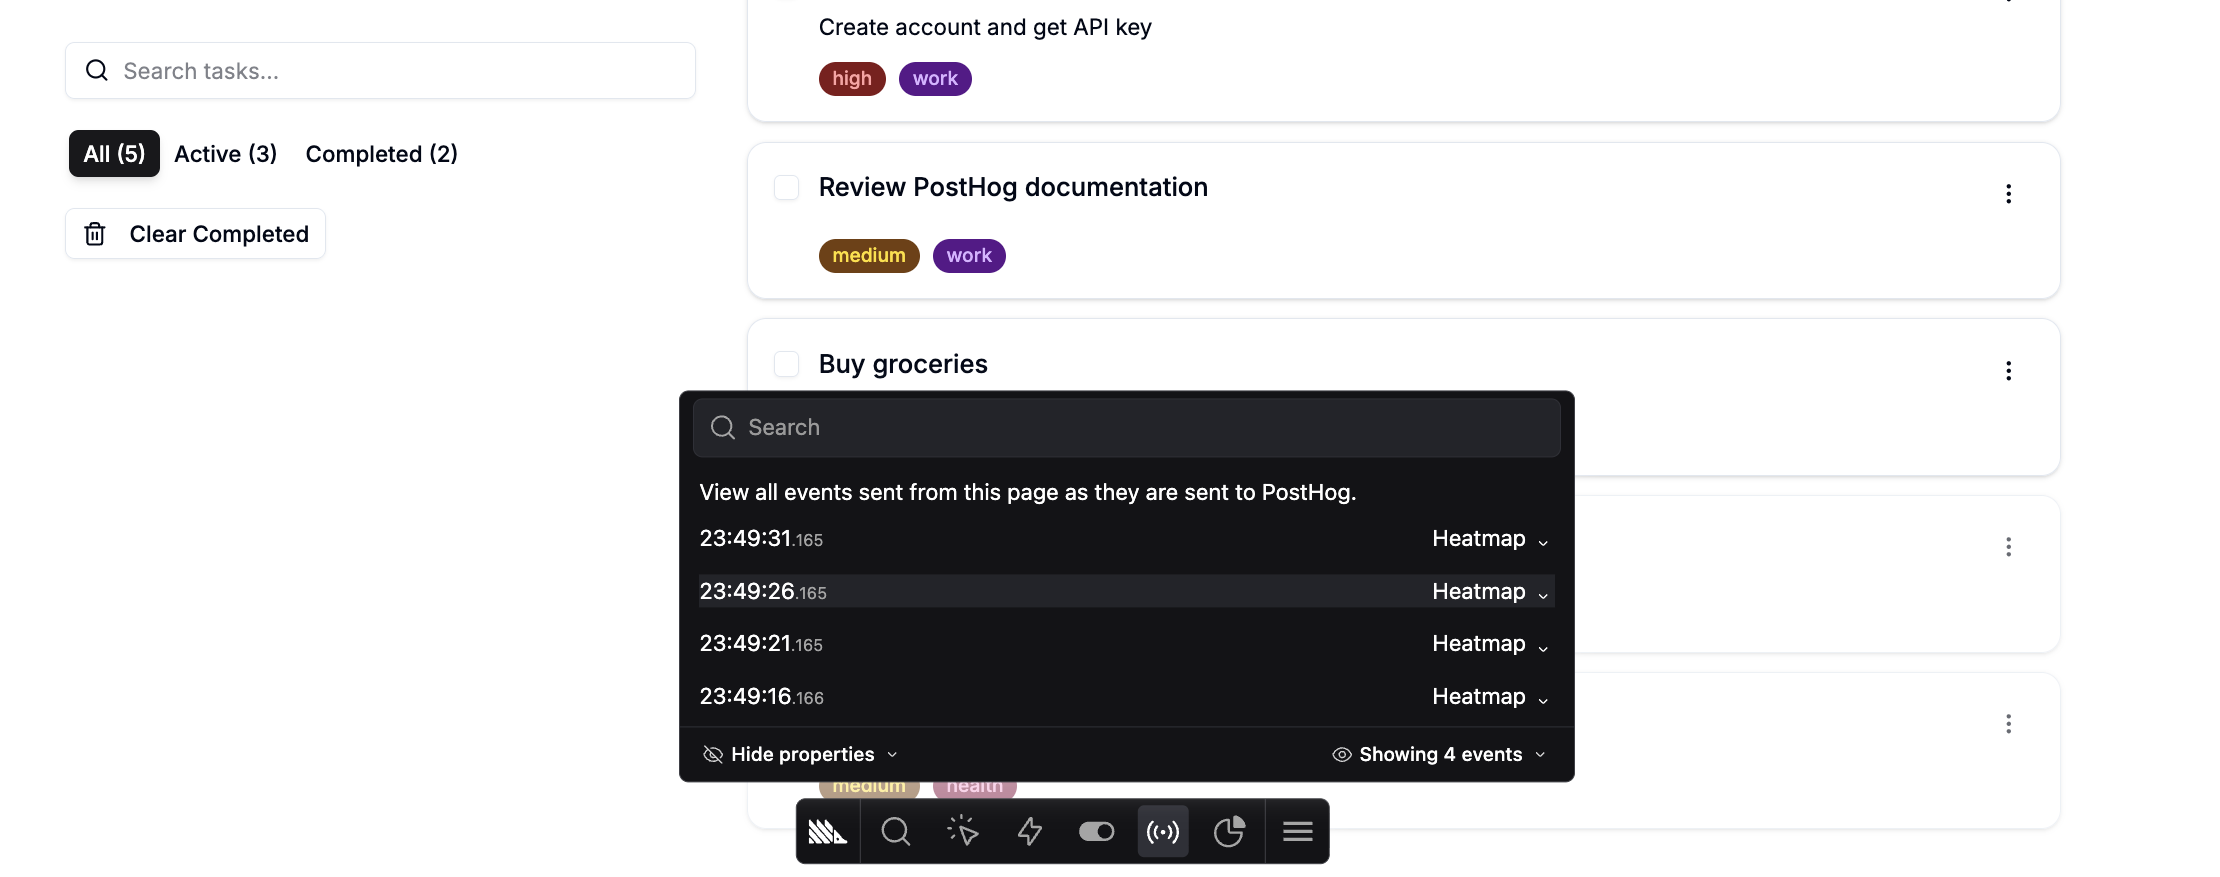
Then I proceeded to the event debugger icon and there isn't much to say here apart from it shows all the events sent to PostHog as it's monitoring your app.
Web Vitals
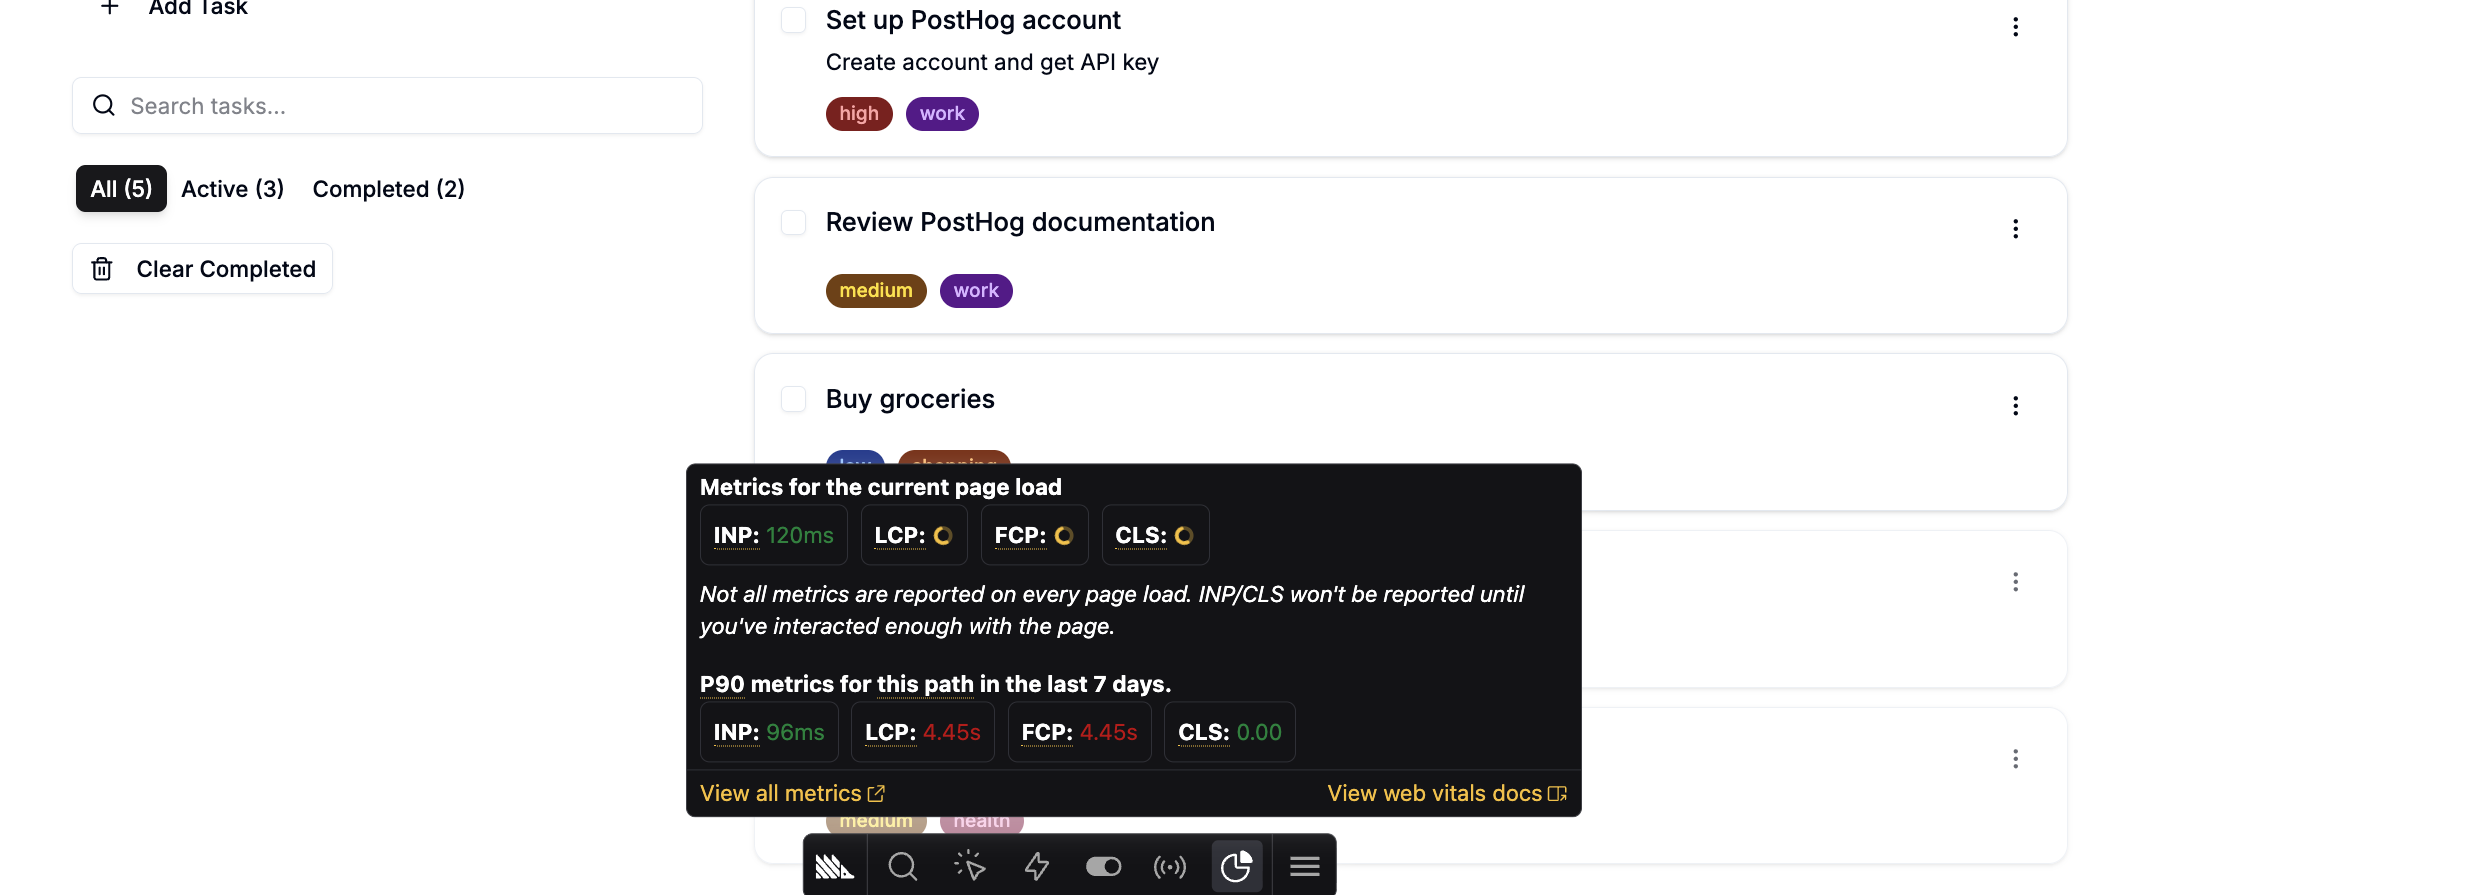
I proceeded to the metrics icon which showed me my web vitals. When I clicked on "View all metrics" CTA, I could see more information on the PostHog app explaining how well my app was performing for users.
Settings
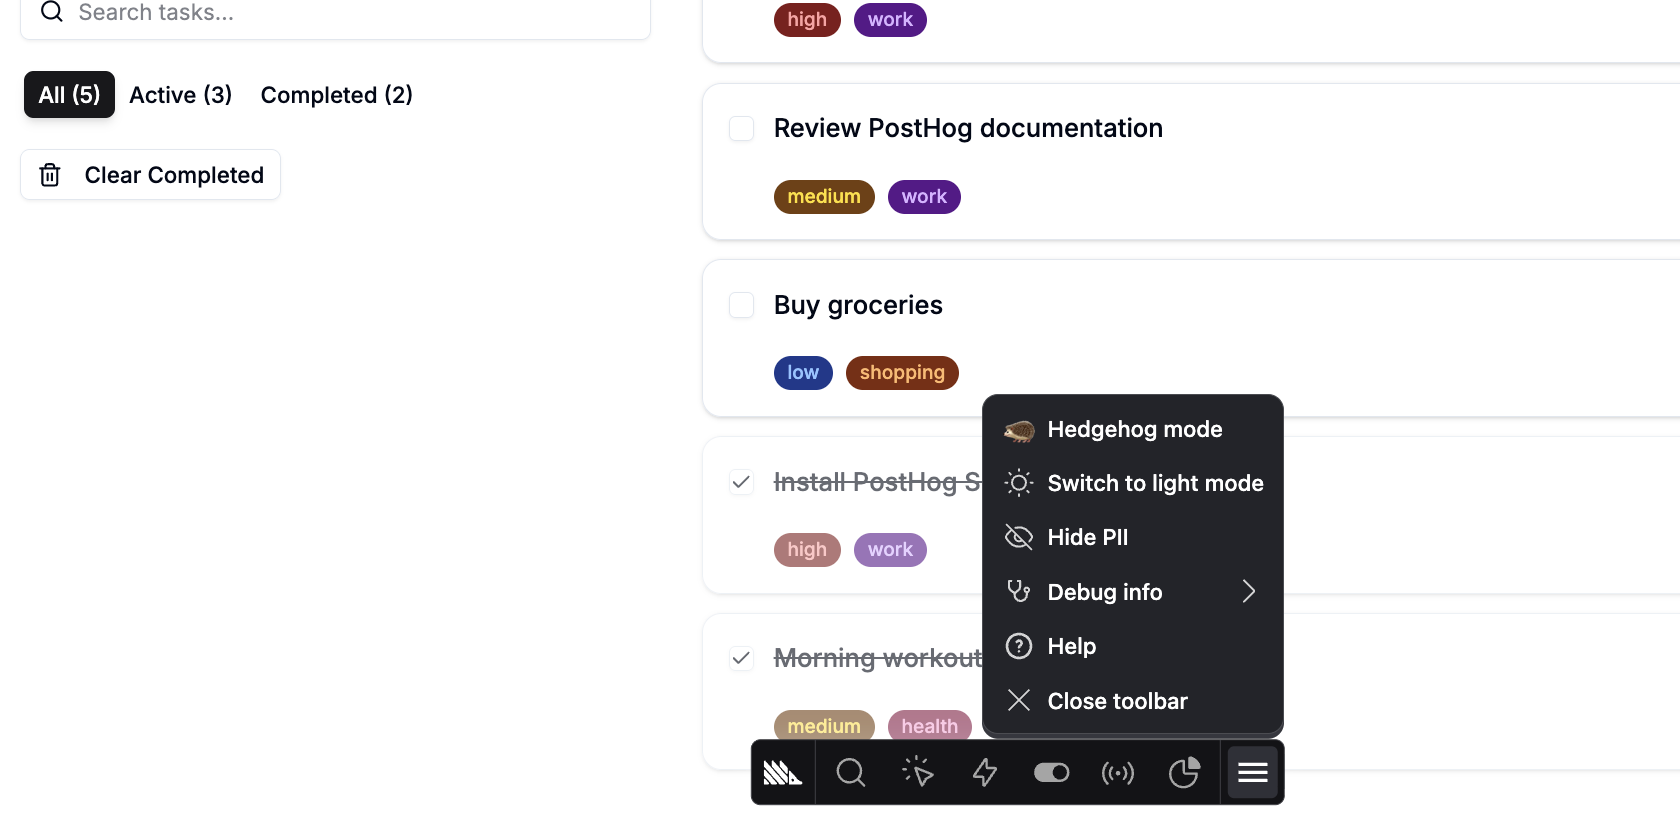
The last icon was the settings icon where I could see more information about my app, switch to light or dark mode, or seek PostHog's help if I have any troubles.
Hedgehog Mode: The Best Discovery
Where I had the most fun was the "Hedgehog mode."
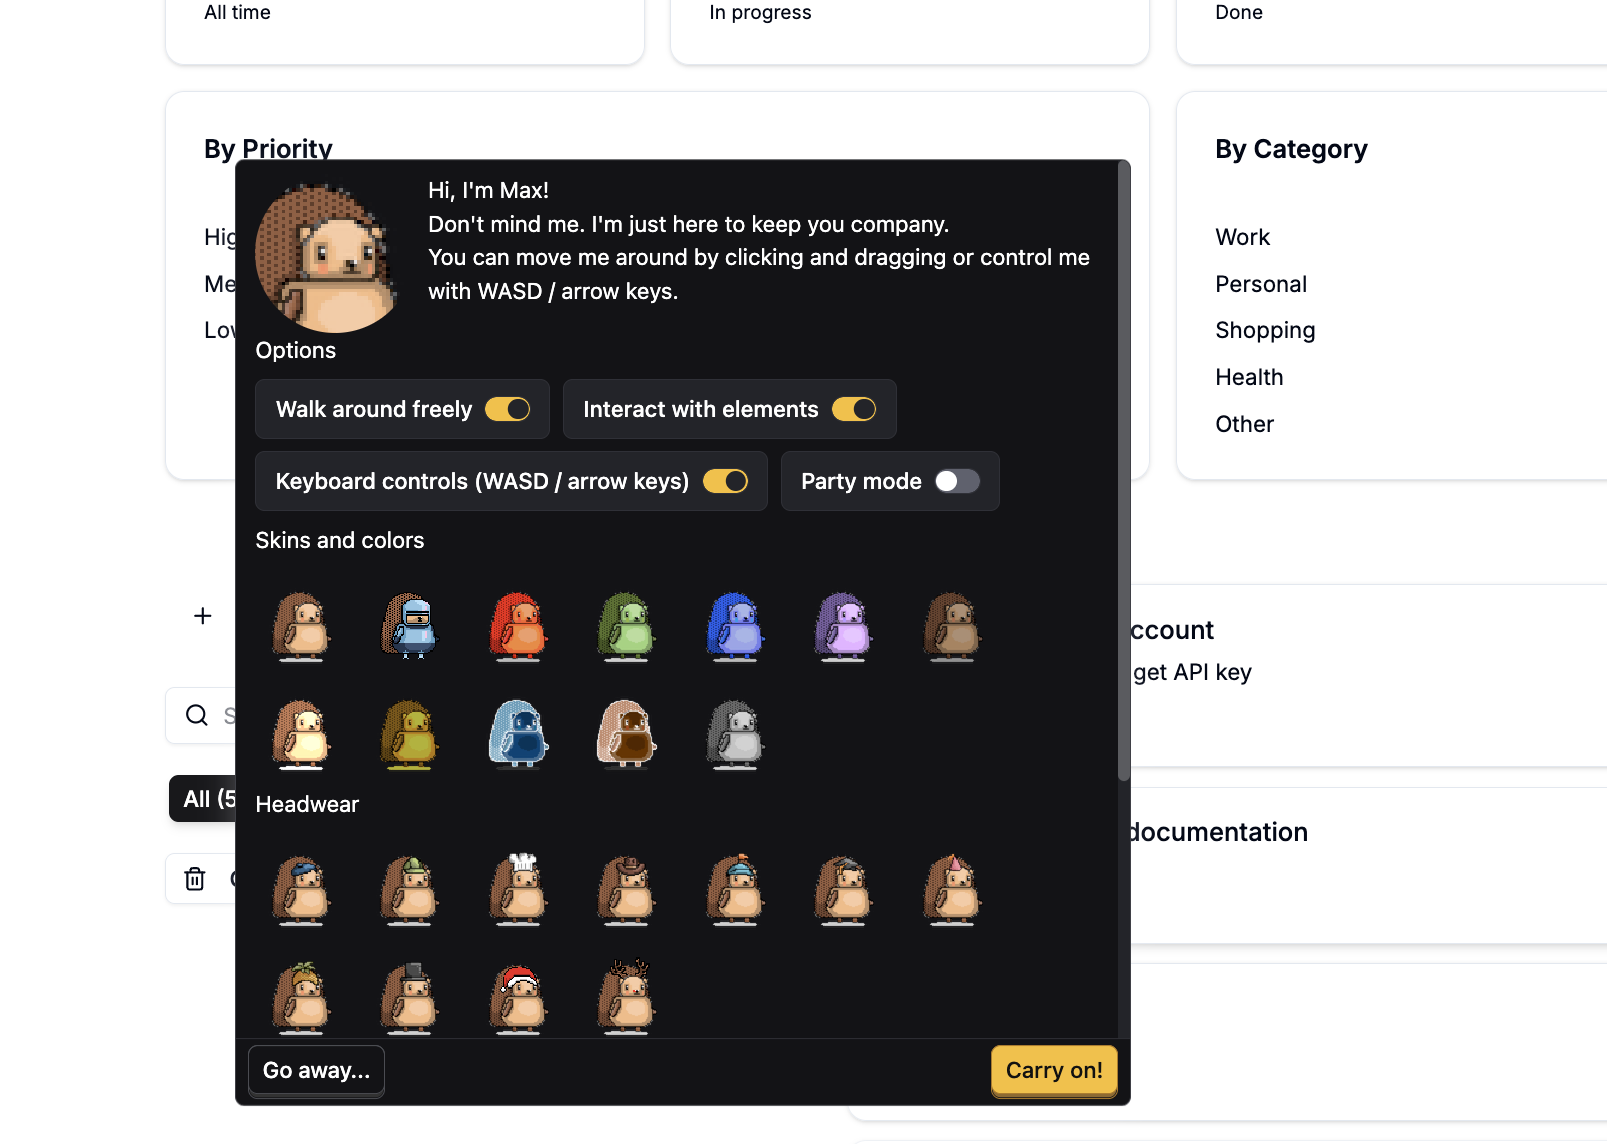
It had this beautiful animated teddy and I could drag the toolbar to any point I wanted when I clicked on the teddy. When I stopped dragging, it danced and moved the toolbar itself.
It was compensation for all my headache. I mean, no better way to compensate me for the "Actions" stress I passed through.
Oh!! What I go through to give you people premium gist. Sigh, we thank God.
What I Learned (Day 4 Takeaways)
1. Toolbar setup is easy, usage is harder
It took 2 minutes to launch the toolbar. It took 2 hours trying to understand Actions.
2. Heatmaps are more intuitive than Actions
I could immediately see where users clicked. Actions showed "no matching queries" for most of my attempts.
3. PostHog needs better error messaging
"No matching queries" doesn't explain WHAT'S wrong or HOW to fix it. Is it a timing issue? A configuration issue? A bug? I still don't know.
4. Visual tracking sounds great in theory
The promise of "no code required" is appealing, but Actions require understanding selectors, filters, and PostHog's matching logic. That's not really "no code."
5. Some features are delightful
Small touches like Hedgehog mode make the product memorable. This kind of personality matters.
6. Documentation doesn't always match reality
I read the Actions docs twice and still couldn't get it to work consistently. There's a gap between what's documented and what new users experience.
7. Custom events might be more reliable
Based on my struggle, I'm thinking custom events (which we'll cover in Phase 2) might be easier than trying to make Actions work.
What Worked Great vs What Was Confusing
What Worked Great:
✅ Toolbar setup (super easy, 2 minutes)
✅ Heatmaps (visual, intuitive, immediately useful)
✅ Clickmaps (showed actual data, clear counts)
✅ Event debugger (simple, shows what's being tracked)
✅ Hedgehog mode (delightful, memorable)
✅ Inspect mode (helpful purple highlights)
What Was Confusing:
❌ Actions (unclear documentation, "no matching queries" with no explanation)
❌ Why some elements were selectable (felt like partia)
❌ Matching queries showed nothing, then randomly appeared
❌ No clear feedback on what was wrong with my Action configuration
❌ The relationship between selectors, filters, and matching
Up Next: Day 5 (or Phase 2)
Phase 1 (Foundations & Reality) is wrapping up.
So far we've covered:
Day 1: What is PostHog? Why self-hosted analytics? ✅
Day 2: Setting Up PostHog Cloud (With the SSR Bug That Almost Broke Me) ✅
Day 3: First Event Tracking + Understanding Your Empty Dashboard ✅
Day 4: Toolbar (visual tracking) ✅
Coming up in Phase 2 (Core Product Analytics):
Day 5: Custom Events - Beyond Page Views
Day 6+: More features...
Tomorrow (or next): We'll dive into custom events and see if they're more reliable than Actions for tracking specific user behaviors.
Stay tuned!
Follow along with the series:
- 🎥 TikTok: [https://www.tiktok.com/@hey_techys?is_from_webapp=1&sender_device=pc]
- 📸 Instagram: [https://www.instagram.com/hey_techys]
- 💼 LinkedIn: [https://www.linkedin.com/in/onyenekwe-elizabeth-46a467183/]
- 🐦 Twitter/X: [https://x.com/ElizabethOnyen6]
Byeeeeeeee!!!!
- Lizzy