Day 3 - First Event Tracking + Understanding Your Empty Dashboard
The Confusing First Look
Hey_Techys!! Day 3 of the PostHog series!
After connecting my Taskflow app to PostHog, I opened the dashboard and... I was lost.
I stared at it for like an hour. Numbers, charts, some data here, "no matching events" there. What am I supposed to be looking at? What should I be looking for?
My toxic trait? I lack patience. So I did what normal people would do - I gave up, went to brunch with friends, just because…… I can’t come and kill myself jare(Lol, no worries, I am still with you guys through thick and thin)
When I got back home, I took a second look. This time, slower. One section at a time.
Here's what I figured out.
What PostHog is Actually Tracking (Without Any Code)
The first thing I noticed: some charts actually have data.
Daily Active Users (DAUs):
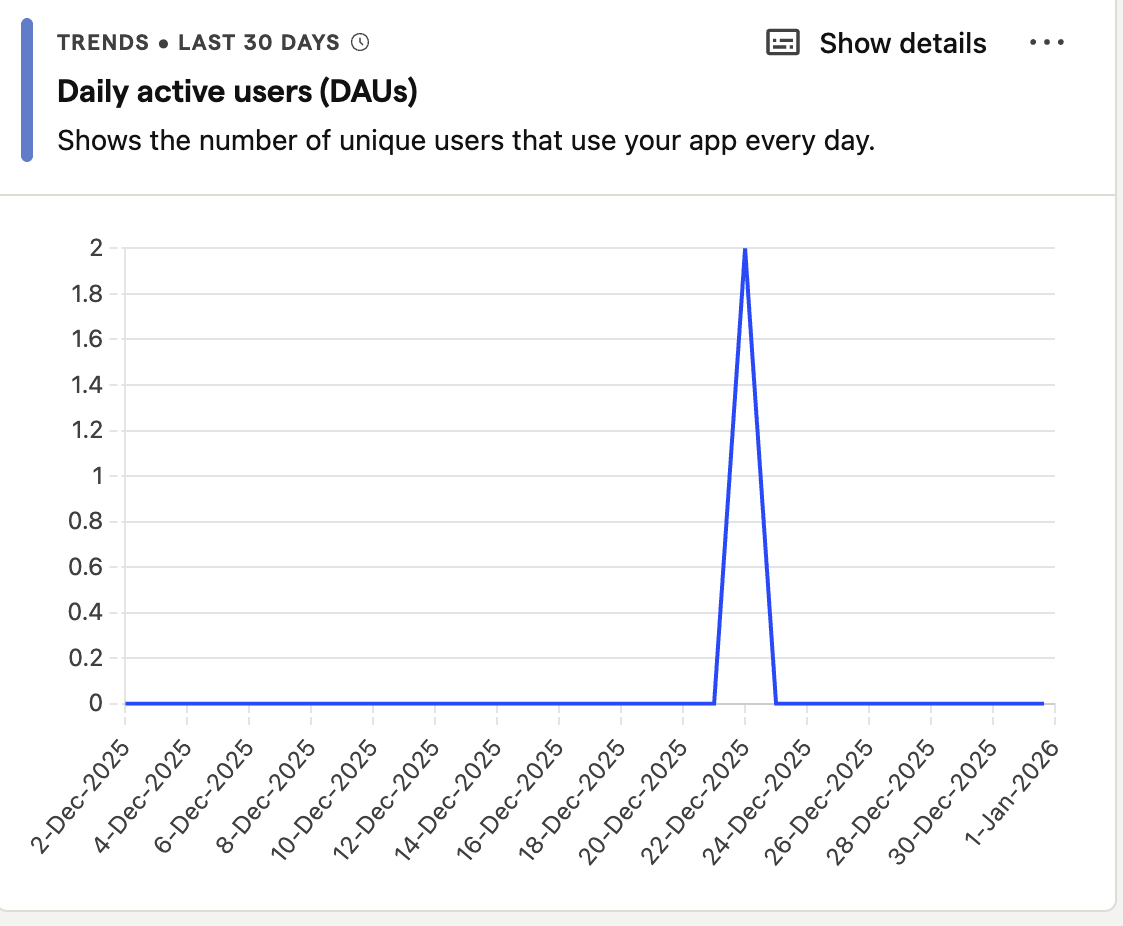
This graph shows unique users per day. When I hovered over it, there was a spike on December 26th - that's me using the app.
Weekly Active Users (WAUs):
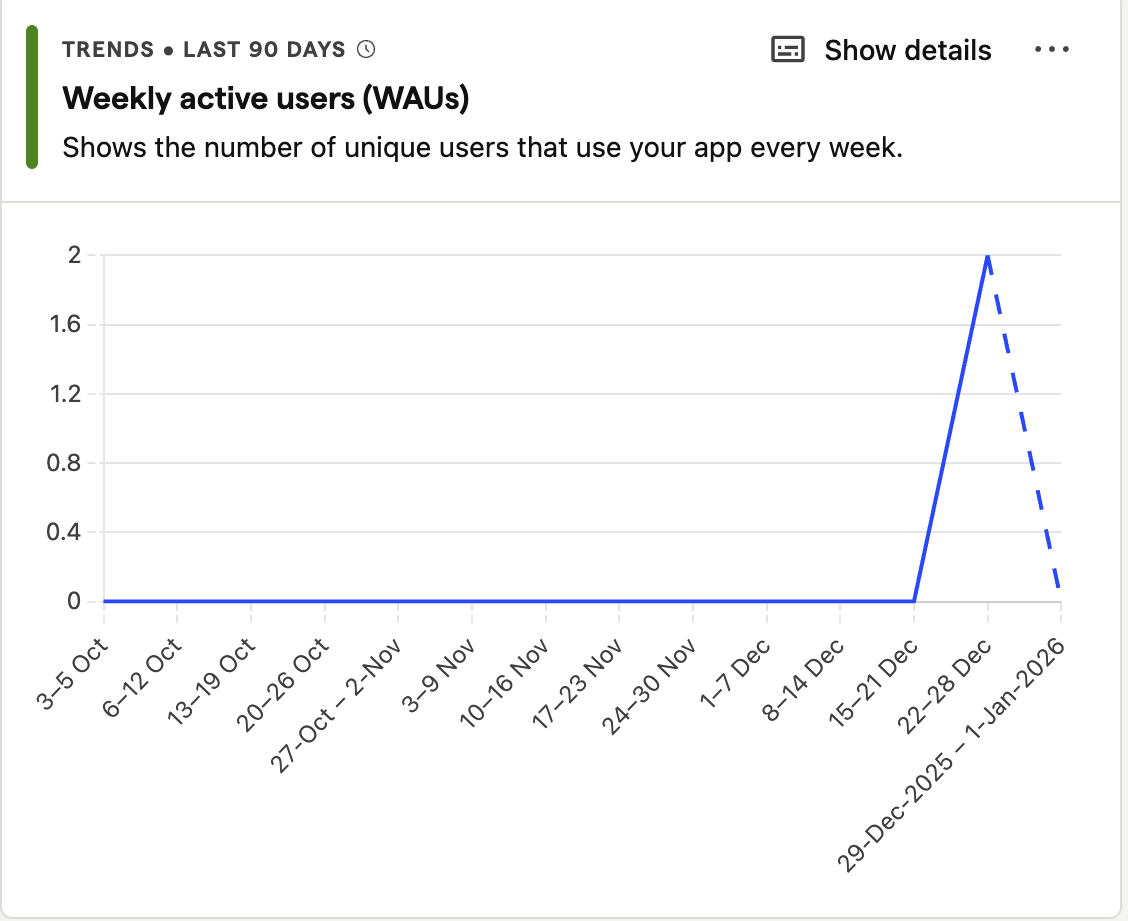
Same thing but weekly. I could see which week had the most activity.
Wait... I didn't write ANY tracking code yet. How does PostHog know this?
Answer: Autocapture.
PostHog automatically tracks:
Page views (every page I visit)
Clicks (every button, link, element)
User sessions (when I'm active)
Referring domains (where users came from)
I literally just connected PostHog and it started capturing everything. No code needed.
The "Product Analytics" Discovery
When I clicked Product Analytics on the left sidebar, I found something amazing.
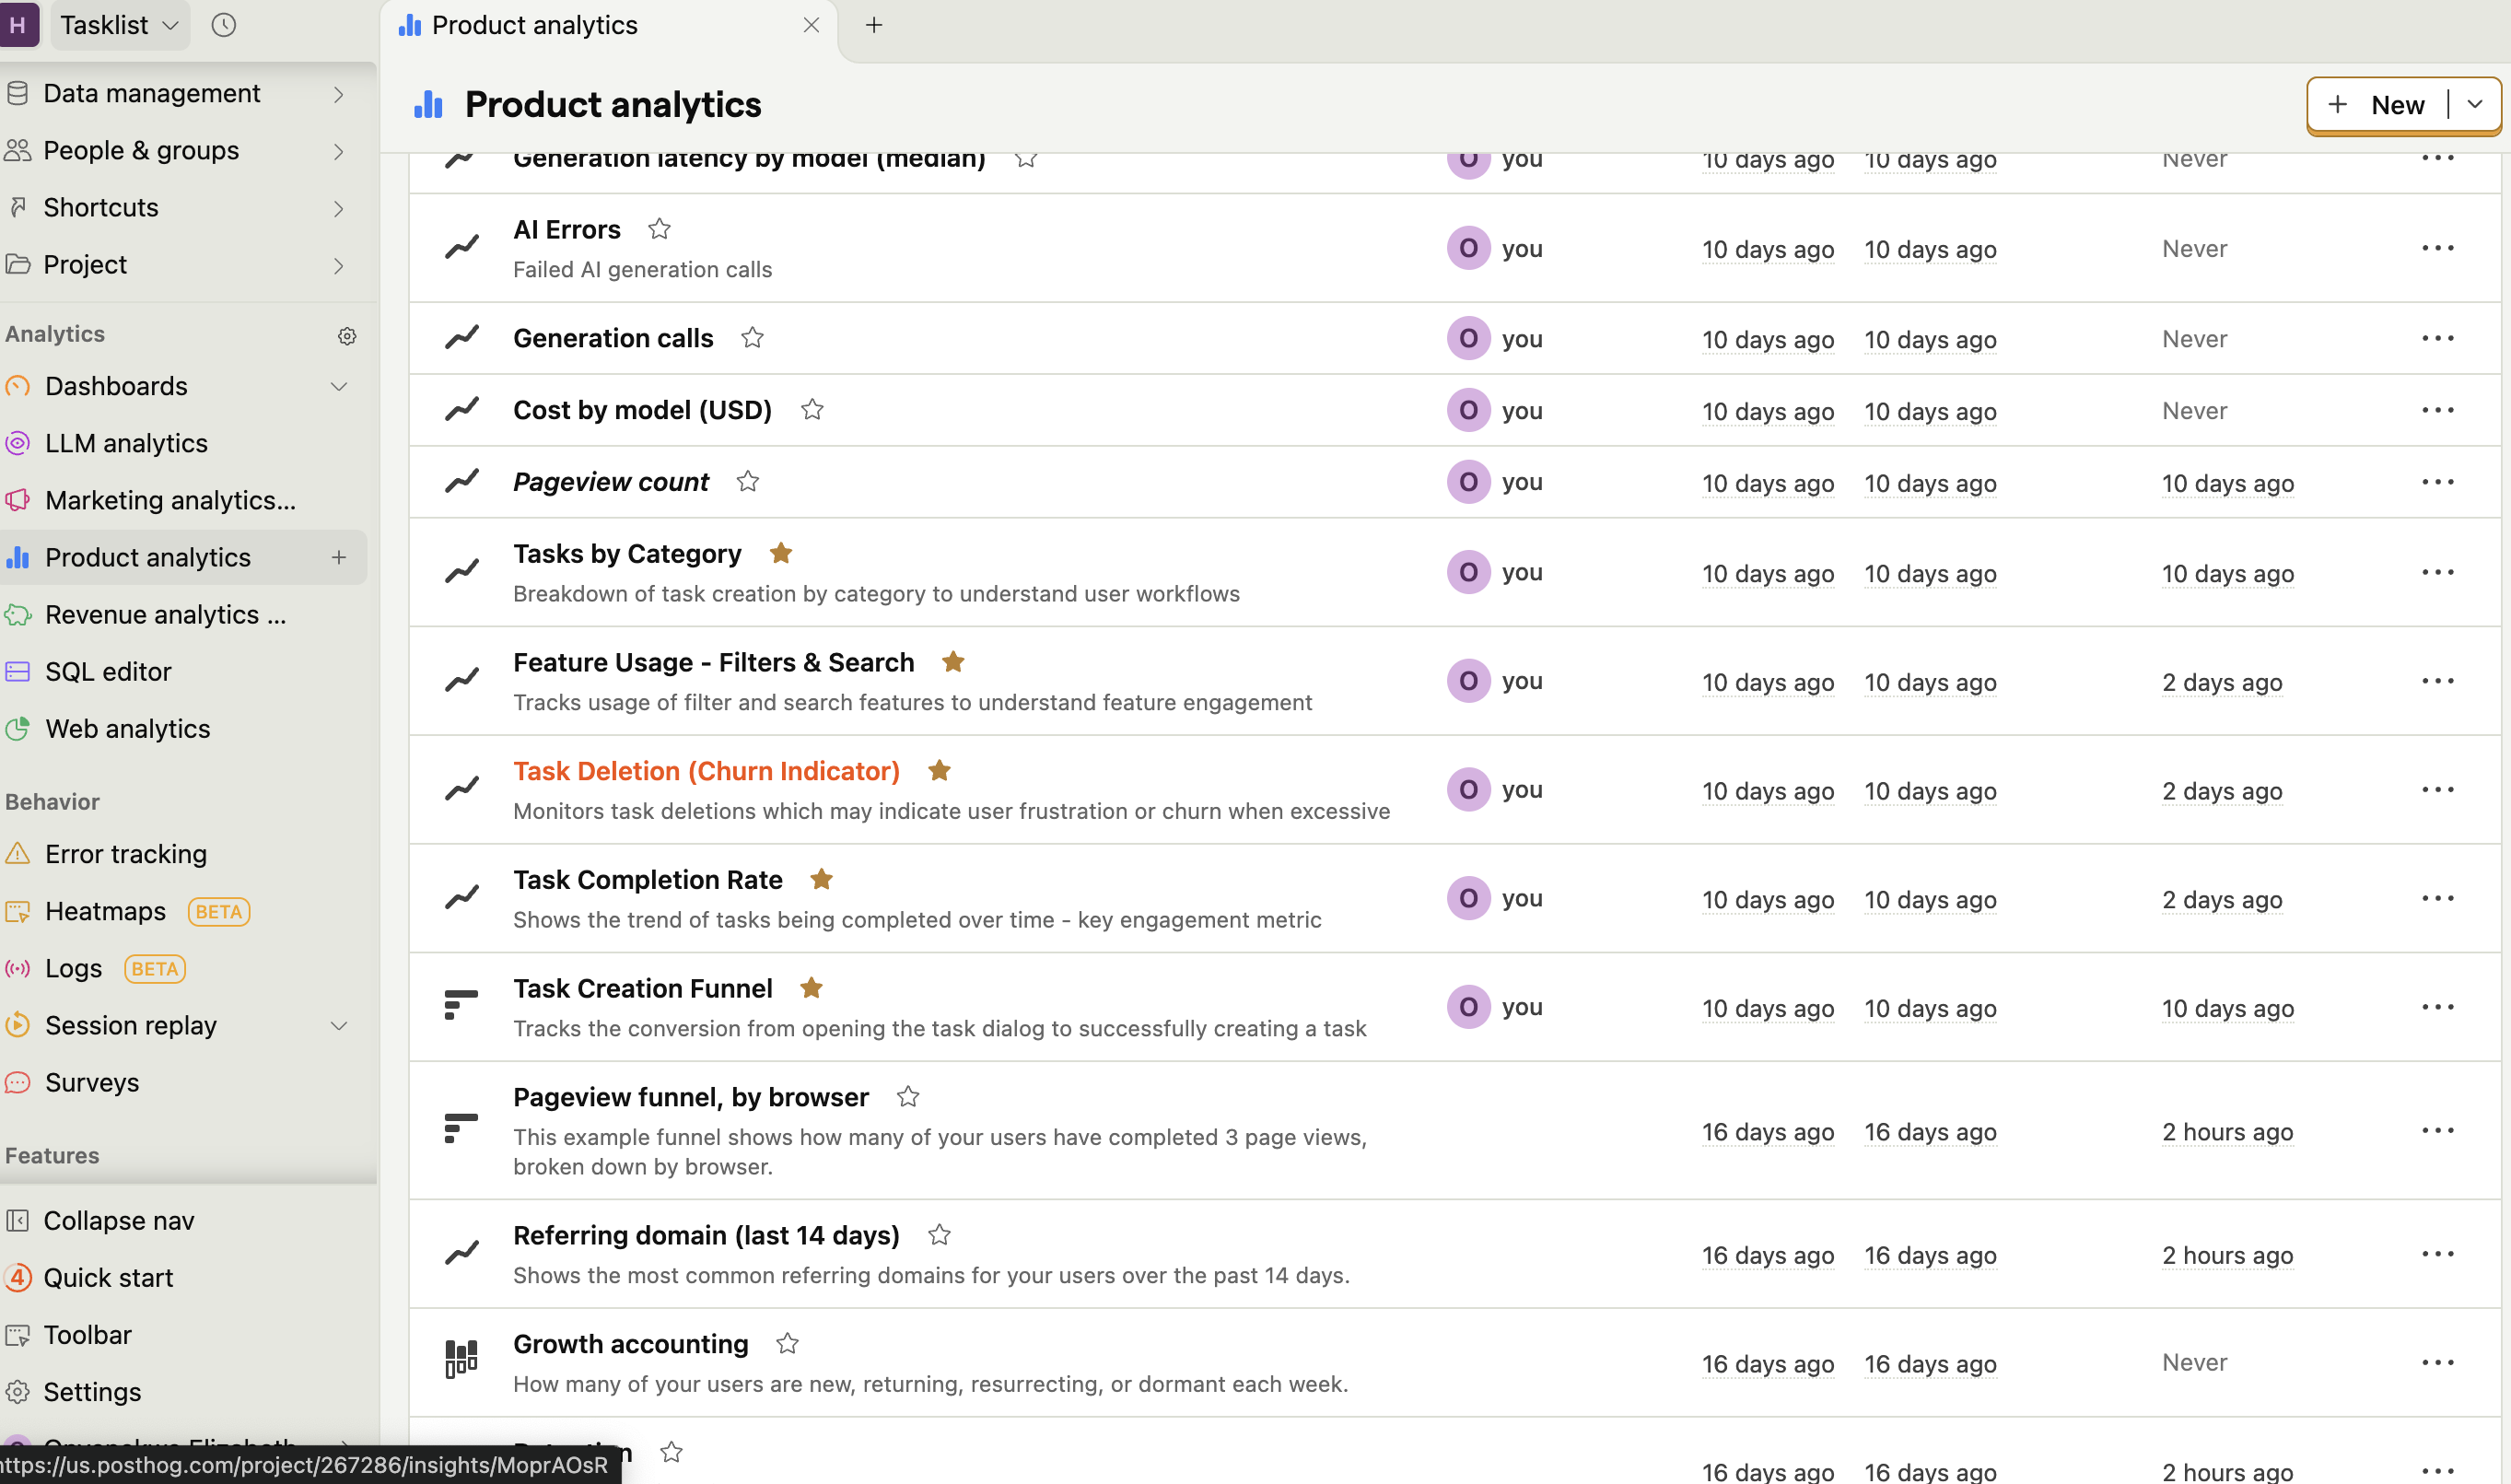
PostHog's AI agent had automatically created analytics for my app based on what it saw:
Tasks by Category - Breakdown of task creation by category
Feature Usage - Filters & Search - Tracks filter/search usage
Task Deletion (Churn Indicator) - Monitors deletions
Task Completion Rate - Shows completion trends
Task Creation Funnel - Tracks the flow from opening dialog to creating task
I didn't create any of these. The agent analyzed my app and set them up automatically.
When you click on any row, it shows you insights: what action was taken, by which user, on what day.
Truly awesome.
Web Analytics - The Google Analytics Alternative
Next, I checked Web Analytics.
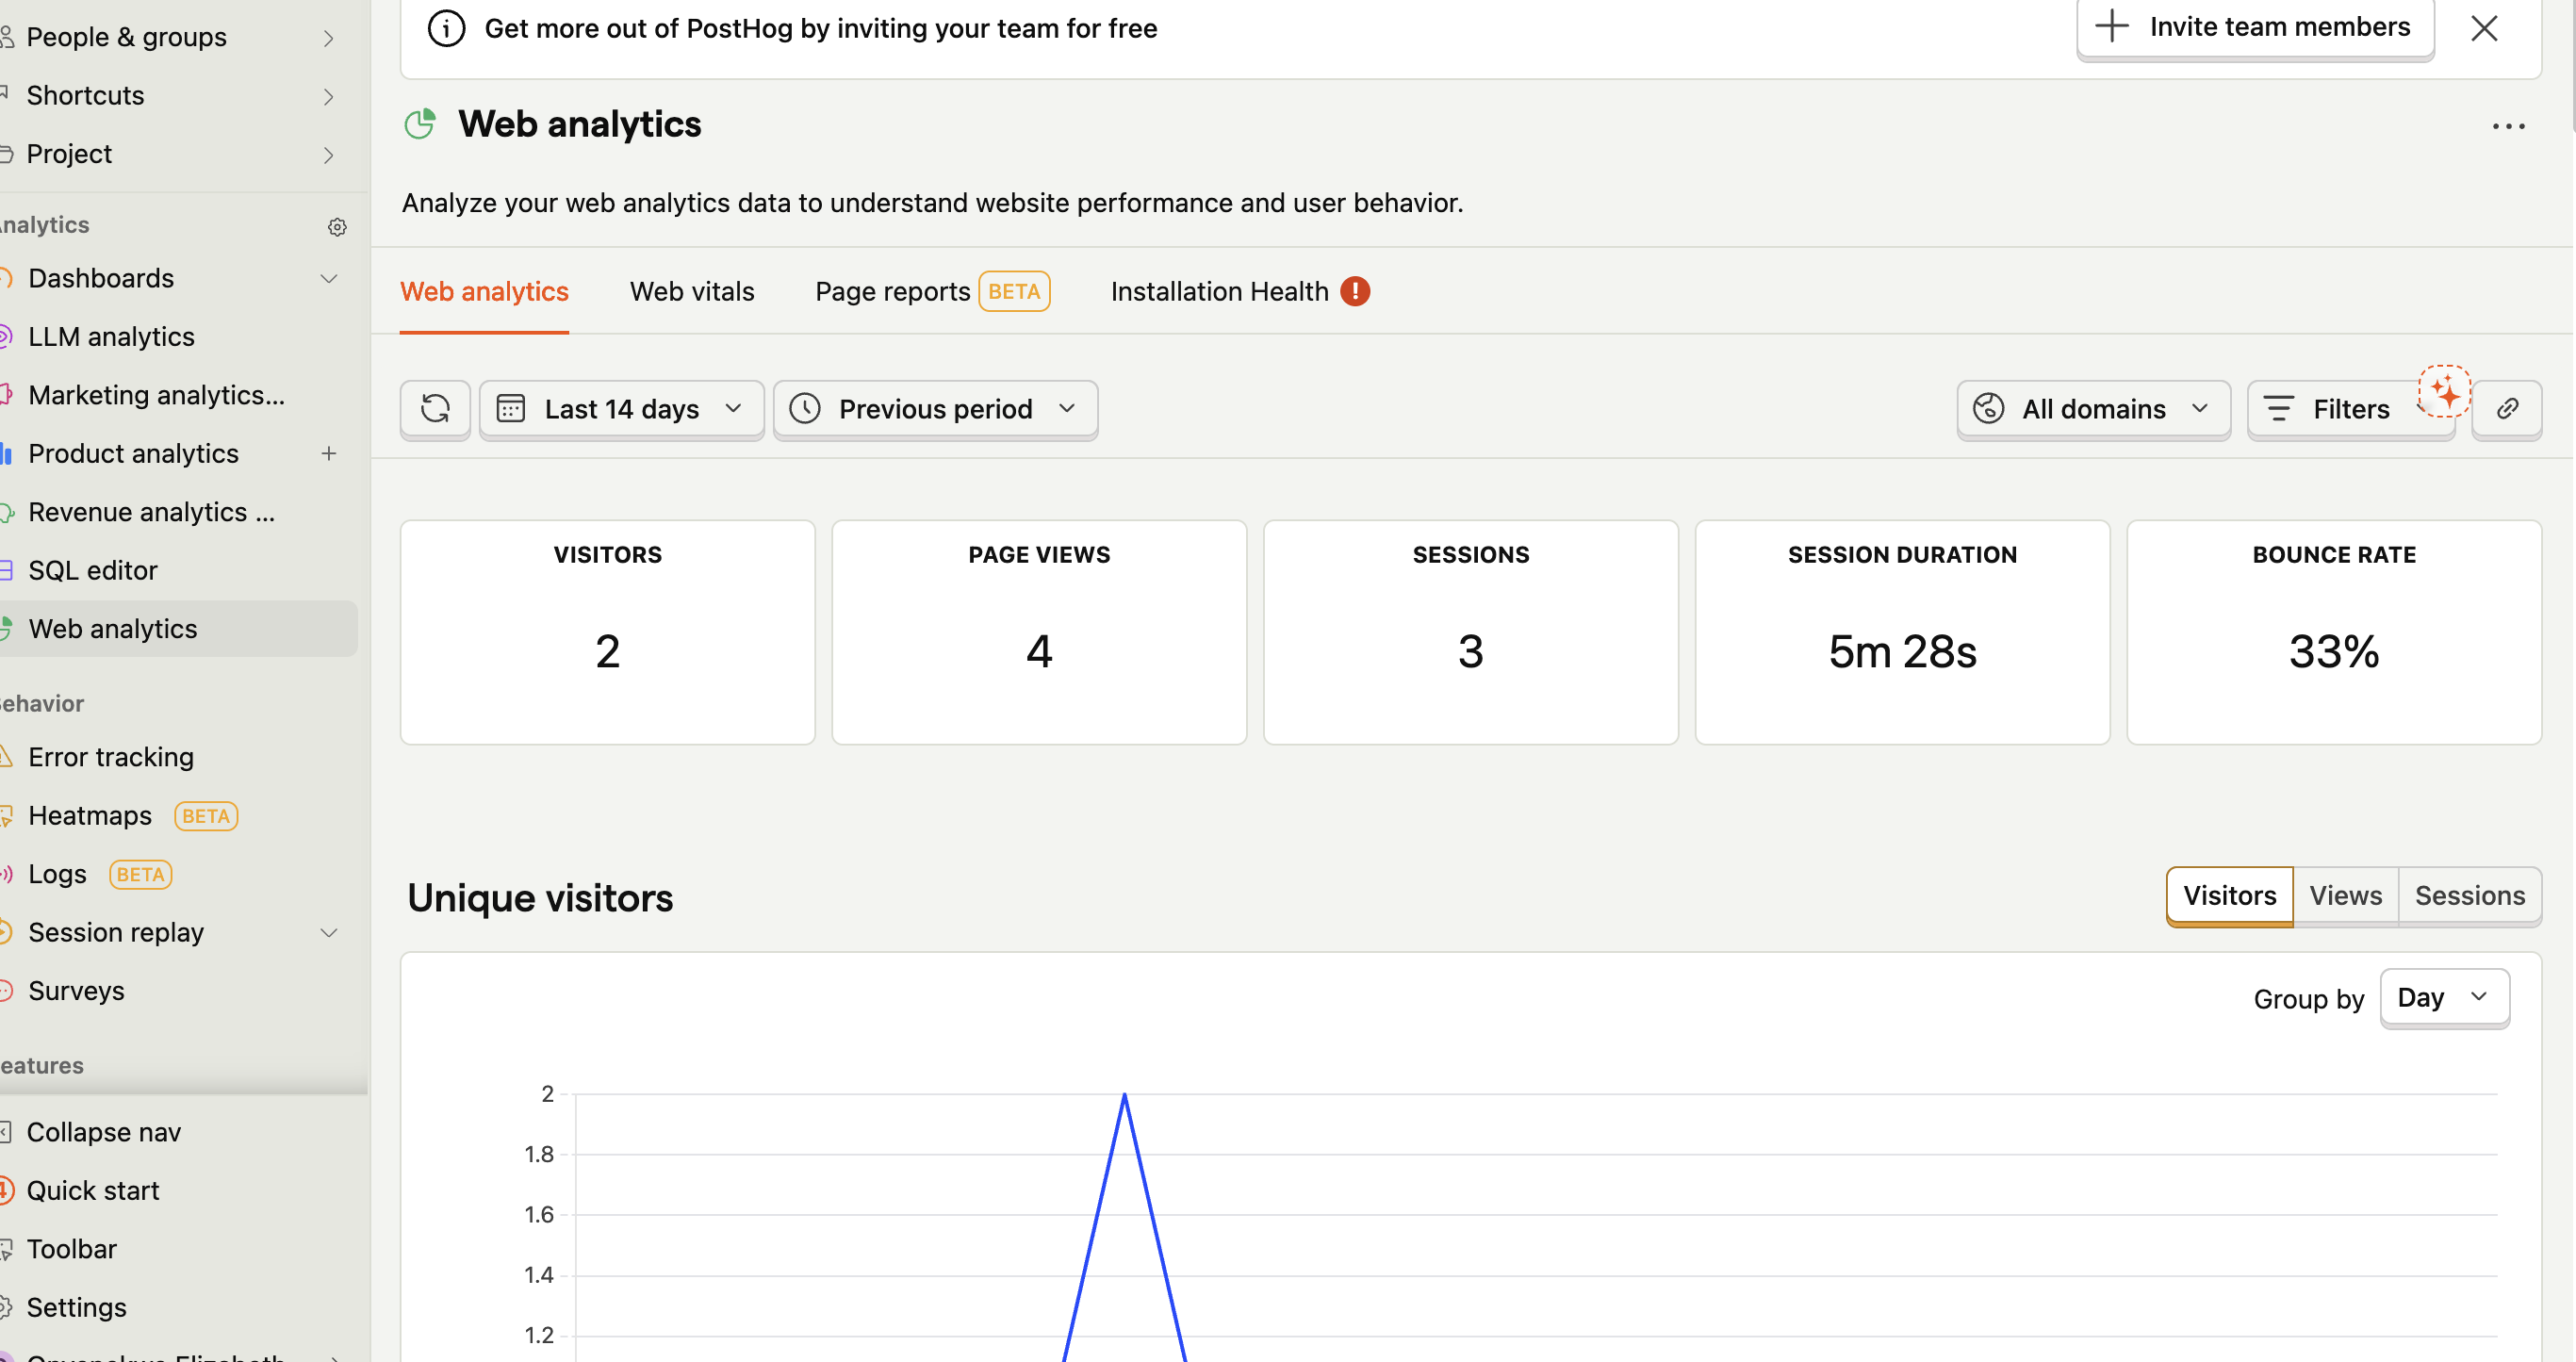
PostHog tracks:
Visitors: 2 unique visitors (me, probably on different devices)
Page views: 4 total pageviews
Sessions: 3 sessions
Session duration: Average 5m 28s
Bounce rate: 33%
This is basically Google Analytics, but built into PostHog. You can see how performant your site is, how long users stay, and what percentage leave immediately.
For a test app with just me clicking around, these numbers are meaningless. But once you have real users, this becomes valuable.
Session Replay - Watching Myself Use the App
The most interesting part of autocapture: Session Replay.
PostHog records user sessions - like a video of what they did on your app.
I clicked on Session Replay in the sidebar and there it was: recordings of me using TaskFlow. Every click, every scroll, every page transition.
It's... slightly creepy? But also incredibly useful. When real users hit bugs or get confused, you can literally watch what they did.
Privacy note: PostHog masks sensitive data by default (passwords, credit cards, etc.). You can configure what gets recorded.
But Wait... Why Are Some Charts Empty?
Here's where I got confused earlier.
Some charts have data (DAUs, WAUs, Web Analytics). Others say "No matching events for this query."
Why?
PostHog's dashboard comes with pre-built queries:
Growth accounting
Retention cohorts
Custom funnels
Conversion rates
These queries are looking for specific custom events like:
"User signed up"
"Task created"
"Payment completed"
I haven't created those events yet. PostHog is capturing pageviews and clicks (autocapture), but these fancy charts want custom events I need to define.
The charts aren't broken. They're just waiting for me to configure them.
Understanding the Data: Signal vs Noise
After exploring for a few hours, here's what I learned about reading the PostHog dashboard:
Meaningful right now (signal):
✅ DAU/WAU trends (basic activity tracking)
✅ Web Analytics (visitor stats)
✅ Session Replays (actual user behavior)
✅ Auto-created Product Analytics (agent-generated insights)
Ignore for now (noise):
❌ Empty funnels (need custom events)
❌ Retention with 2 test users (meaningless)
❌ Growth accounting (need more data)
❌ "No matching events" charts (not configured yet)
The rule: If a chart says "no matching events," you haven't set it up yet.
What I Learned (Day 3 Takeaways):
1. Empty dashboard ≠ broken setup
PostHog IS tracking (you can see DAUs, pageviews, sessions). The empty charts just need configuration.
2. Autocapture is powerful
Without writing any code, PostHog knows what pages I visited, what I clicked, and how long I stayed. That's already valuable.
3. The AI agent is impressive
It created Product Analytics automatically based on my app's actions. I didn't have to configure anything.
4. Session Replay is the killer feature
Being able to watch user sessions will be incredibly valuable for debugging and understanding user behavior.
5. Test data is meaningless
My "2 visitors, 33% bounce rate" stats don't matter - I'm just testing. Real insights come with real users.
6. There's still more to explore
I saw autocapture working, but there's a PostHog Toolbar that supposedly makes event tracking even easier. I haven't tried it yet.
Up Next: Day 4 - PostHog Toolbar
Tomorrow, I'm exploring the PostHog Toolbar - a visual way to track events without writing code.
From what I've seen in the docs, you can:
Inspect elements visually
Create events by clicking
Test tracking in real-time
No code required
Sounds too good to be true? We'll see.
Follow along with the series:
- 🎥 TikTok: [https://www.tiktok.com/@hey_techys?is_from_webapp=1&sender_device=pc]
- 📸 Instagram: [https://www.instagram.com/hey_techys]
- 💼 LinkedIn: [https://www.linkedin.com/in/onyenekwe-elizabeth-46a467183/]
- 🐦 Twitter/X: [https://x.com/ElizabethOnyen6]
Byeeeeeeee!!!!
- Lizzy